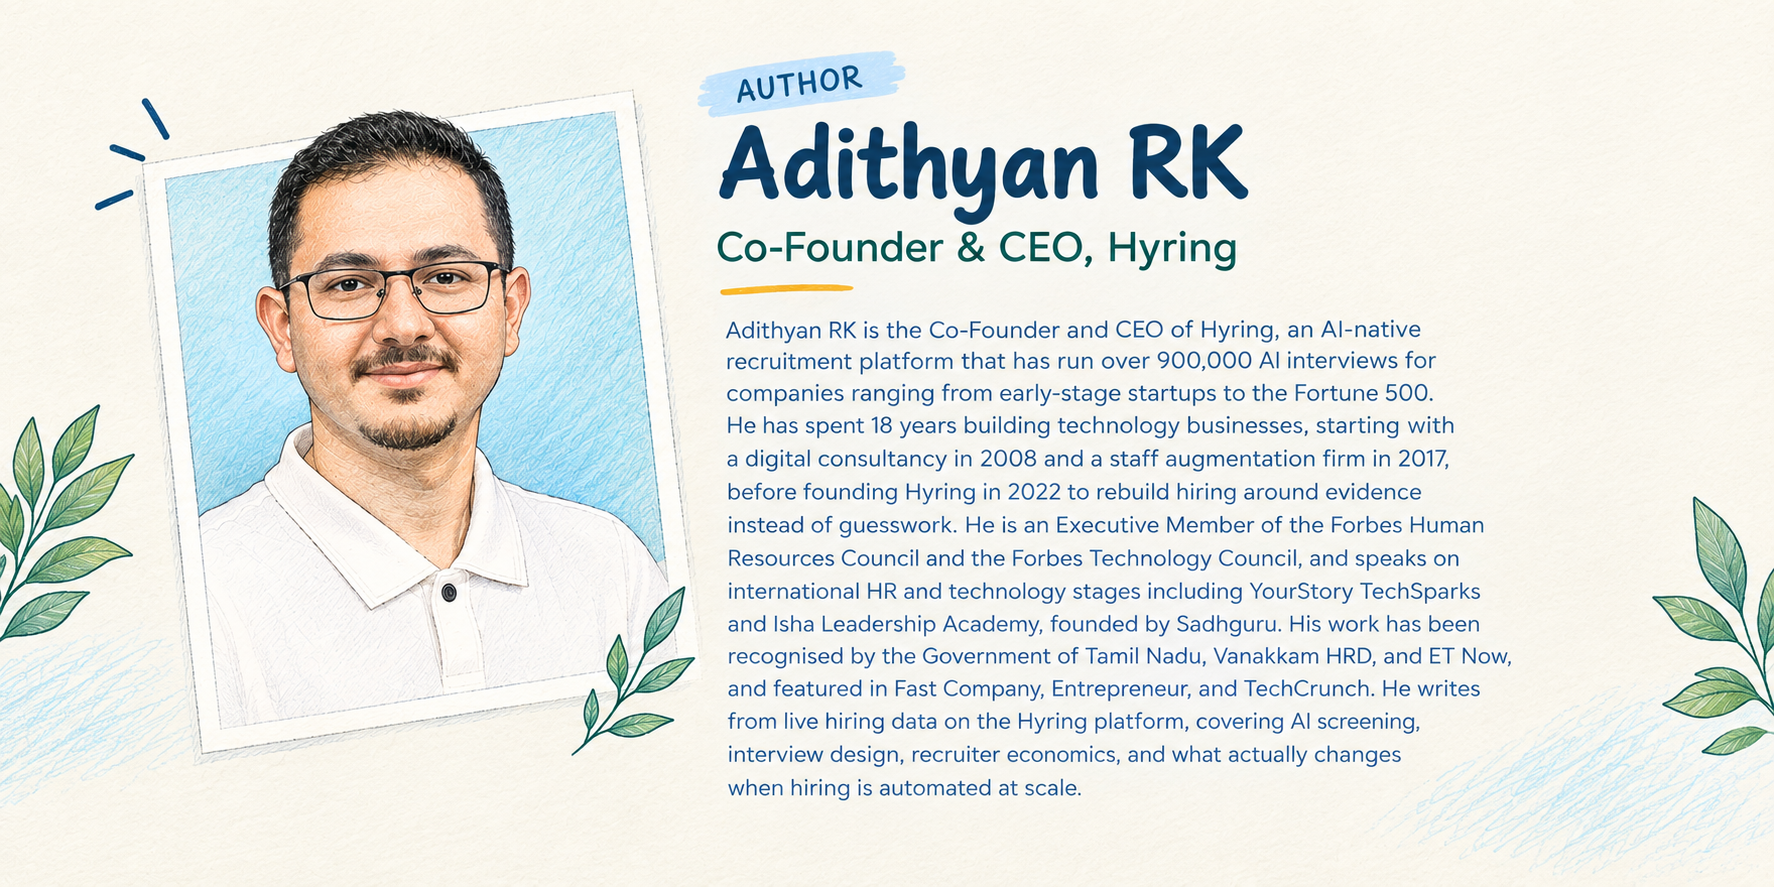
A note on the publisher: Hyring, our co-publisher, builds two things relevant to everything above. Its recruiting platform runs AI-native screening including the AI Interviewer and Hyring Meet which is a virtual interview platform, and has run interviews for more than 5,000 HR teams.
Its newer product, Insight, is an AI time tracker and workforce-analytics software built around close cousins of the four categories in Chapter 2 (meeting load, tool switching, interruption rate, schedule displacement), delivered through an interface that consists of an avatar or an on-screen companion rather than a bare dashboard. It nudges the employee instead of accusing them, and also has the option of focus-music rooms for remote individuals, peer kudos, and a business-intelligence assistant that explains a day’s activity data instead of just logging it. It carries a 5.0 rating on G2, 4.8 on Capterra, and 4.9 on both Product Hunt and Trustpilot. Since Insight is relatively new, there were no data inferences from it that were included in this report.
[Sources: https://hyring.com/ & https://hyring.com/insight]
What the Data Shows
These are the eight findings that shaped the report, and each of them can be read on its own.
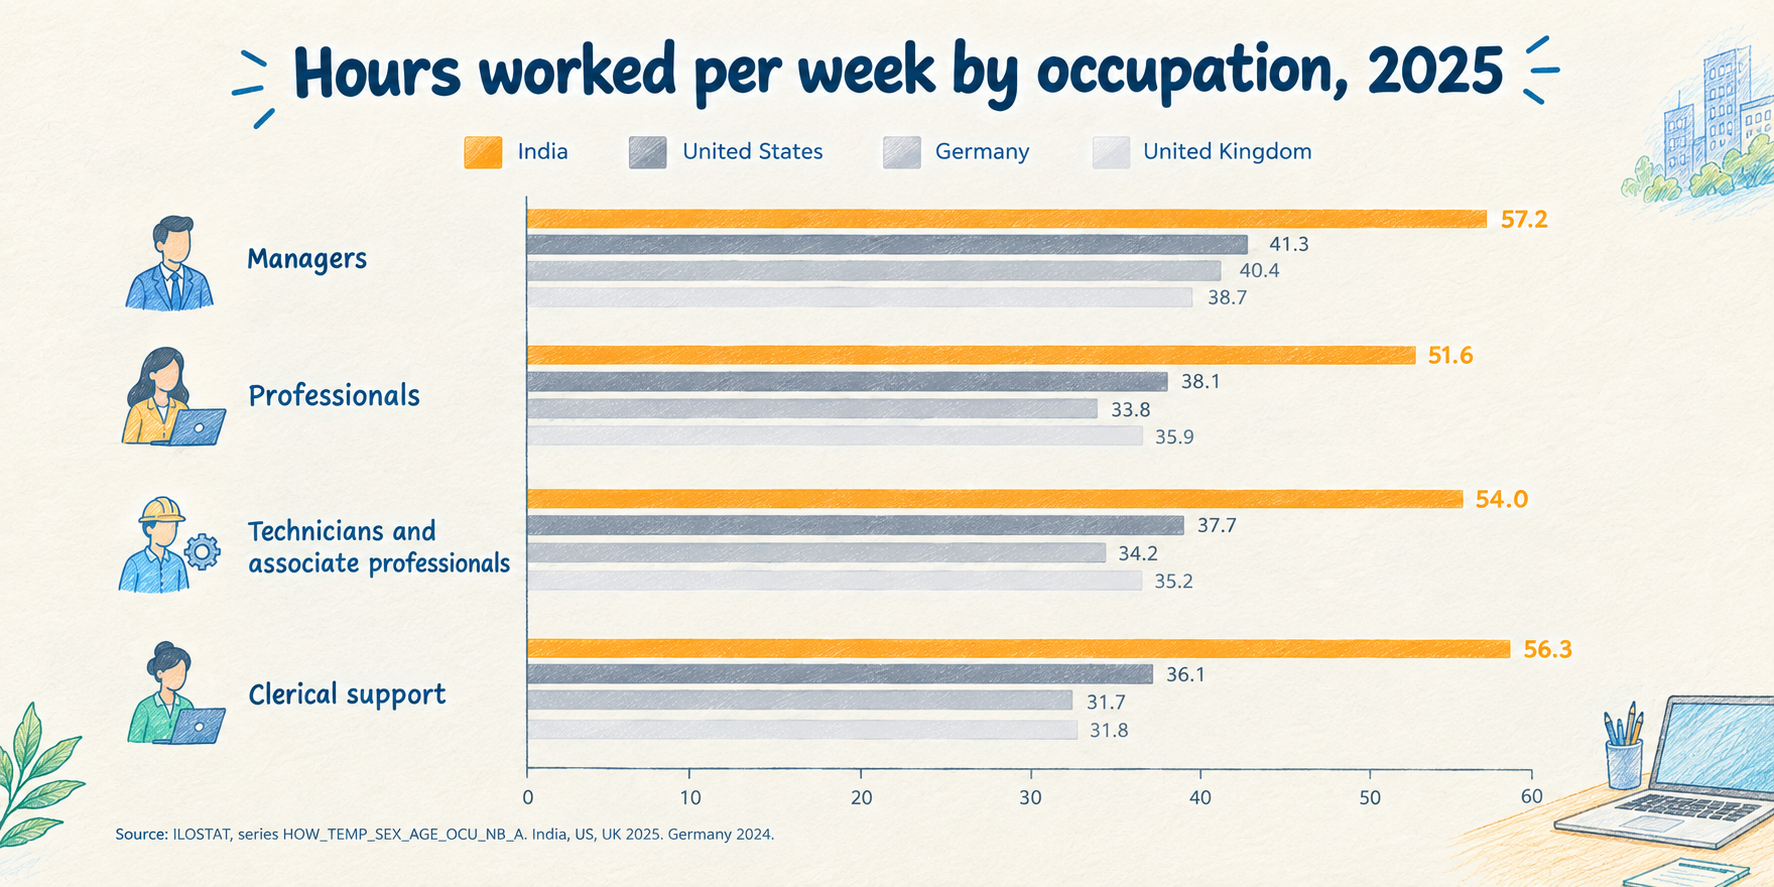
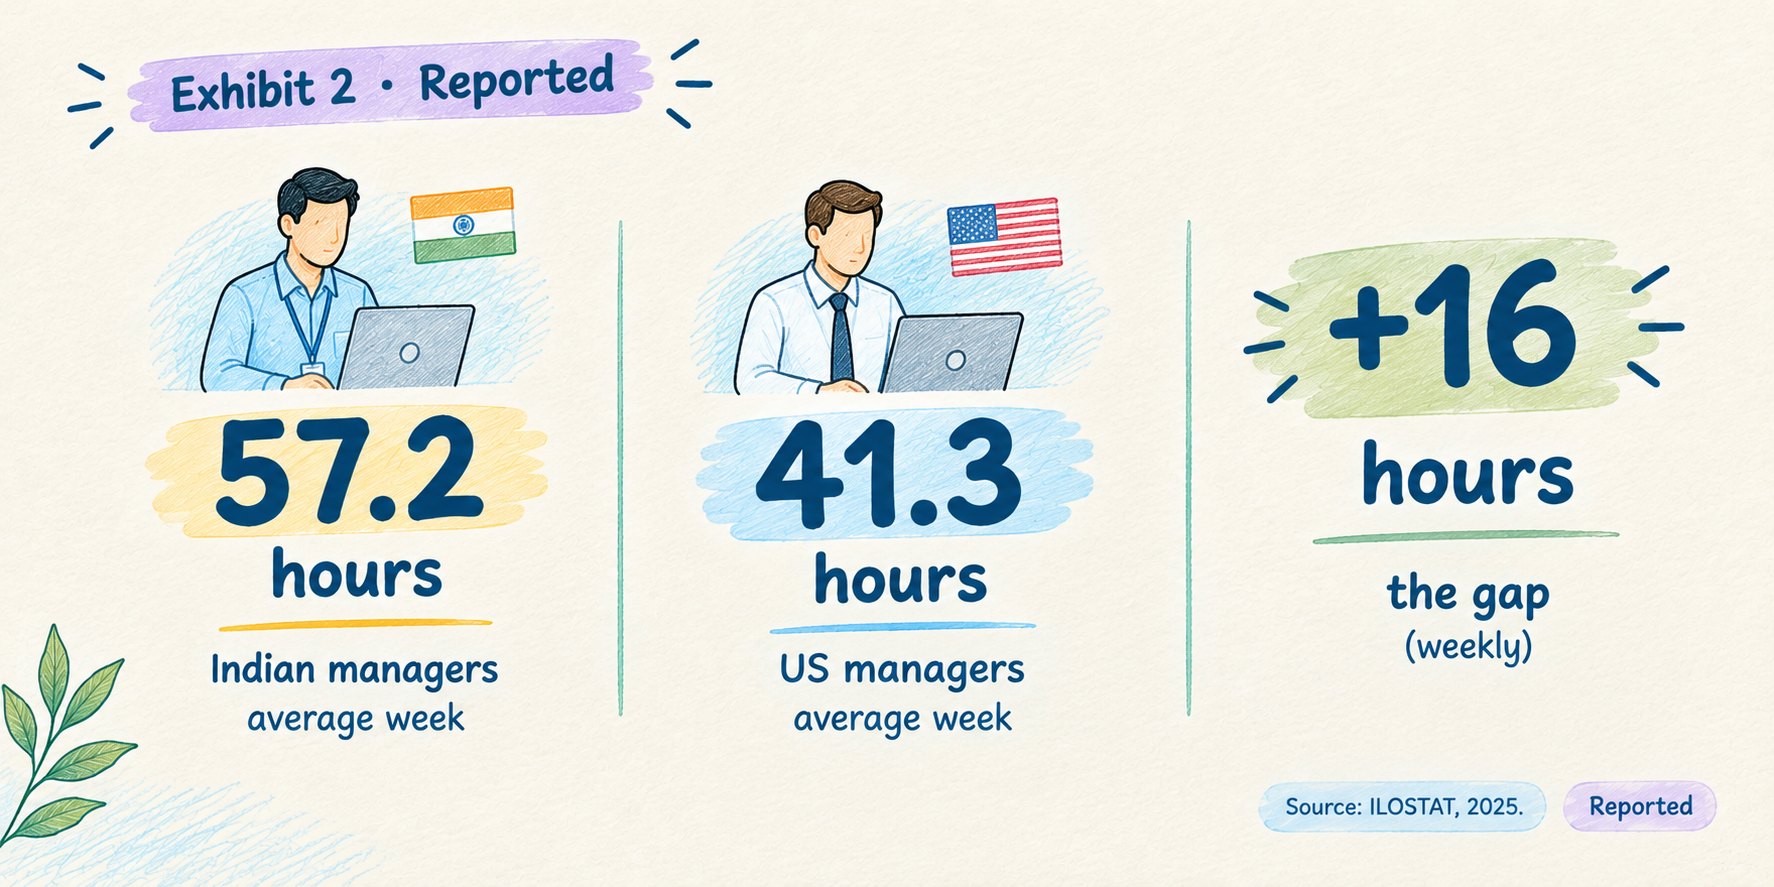
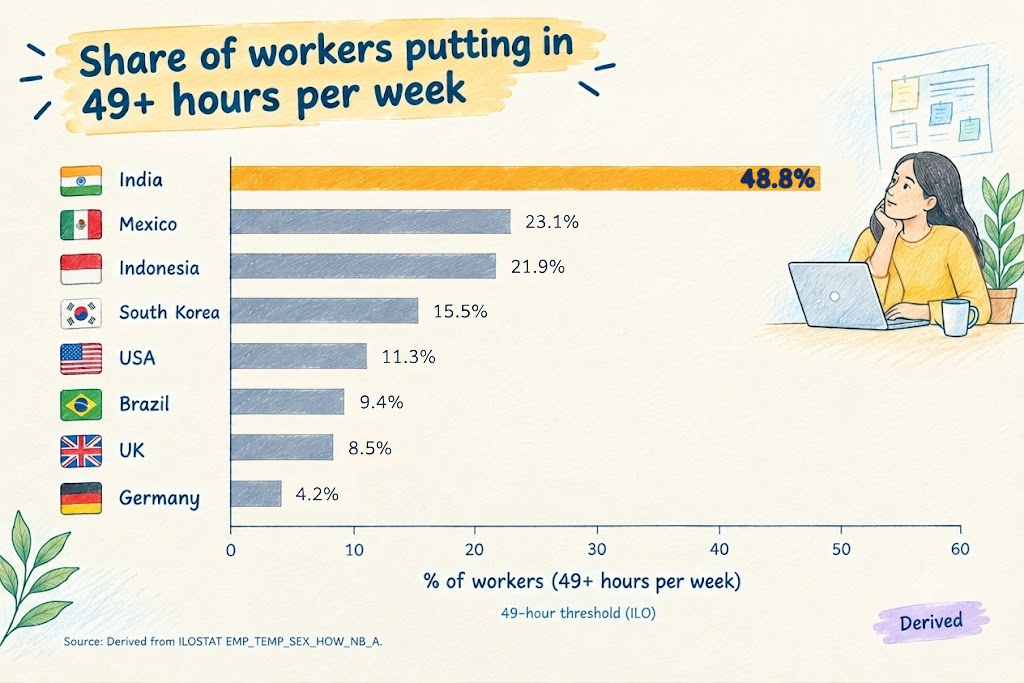
Indian white-collar work hours are among the highest measured anywhere in the world. Managers work 57.2 hours a week and professionals 51.6, whereas the American figures are 41.3 and 38.1 respectively and 40.4 and 33.8 respectively for Germany. Almost half of the country already works past the point that the International Labour Organization considers to be excessive. India sits at 48.8% for 49-plus hours a week, where the United States, United Kingdom and Germany sit at 11.3%, 8.5% and 4.2% respectively. (Source: ILOSTAT, 2025; threshold per ILO convention.)
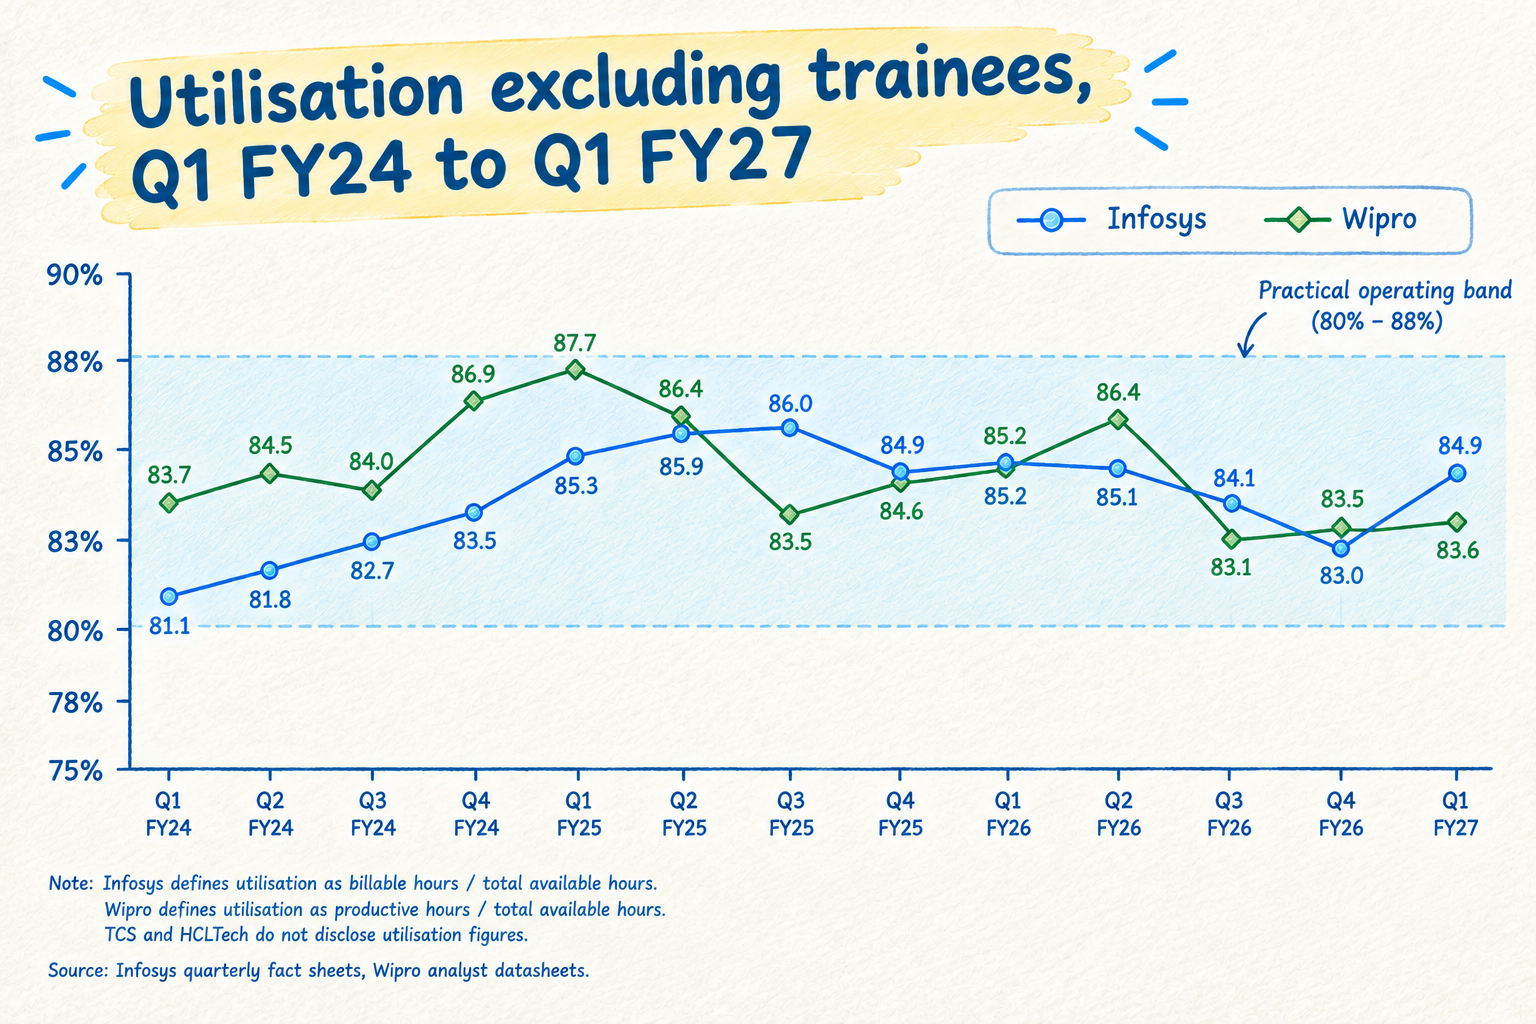
Utilisation at Infosys and Wipro has held between 81% and 88% across thirteen quarters, which leaves very little leeway in the system to extract contradictory to the former’s founder voice. (Source: Infosys and Wipro quarterly disclosures.)
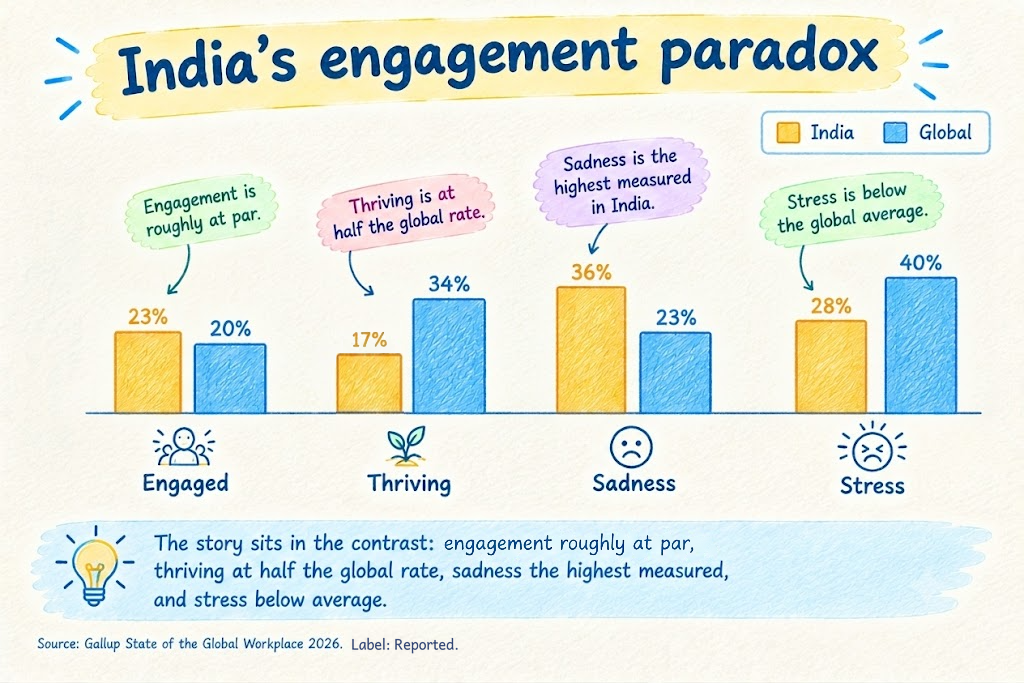
Working hard doesn't mean thriving. Over the past three years, engagement among Indian employees dropped from 33% to 23%, with barely 17% feeling fulfilled at work. Gallup's State of the Global Workplace 2026 report reveals a troubling trend: even as working hours stay constant, India now records the highest rate of daily sadness among workers globally.
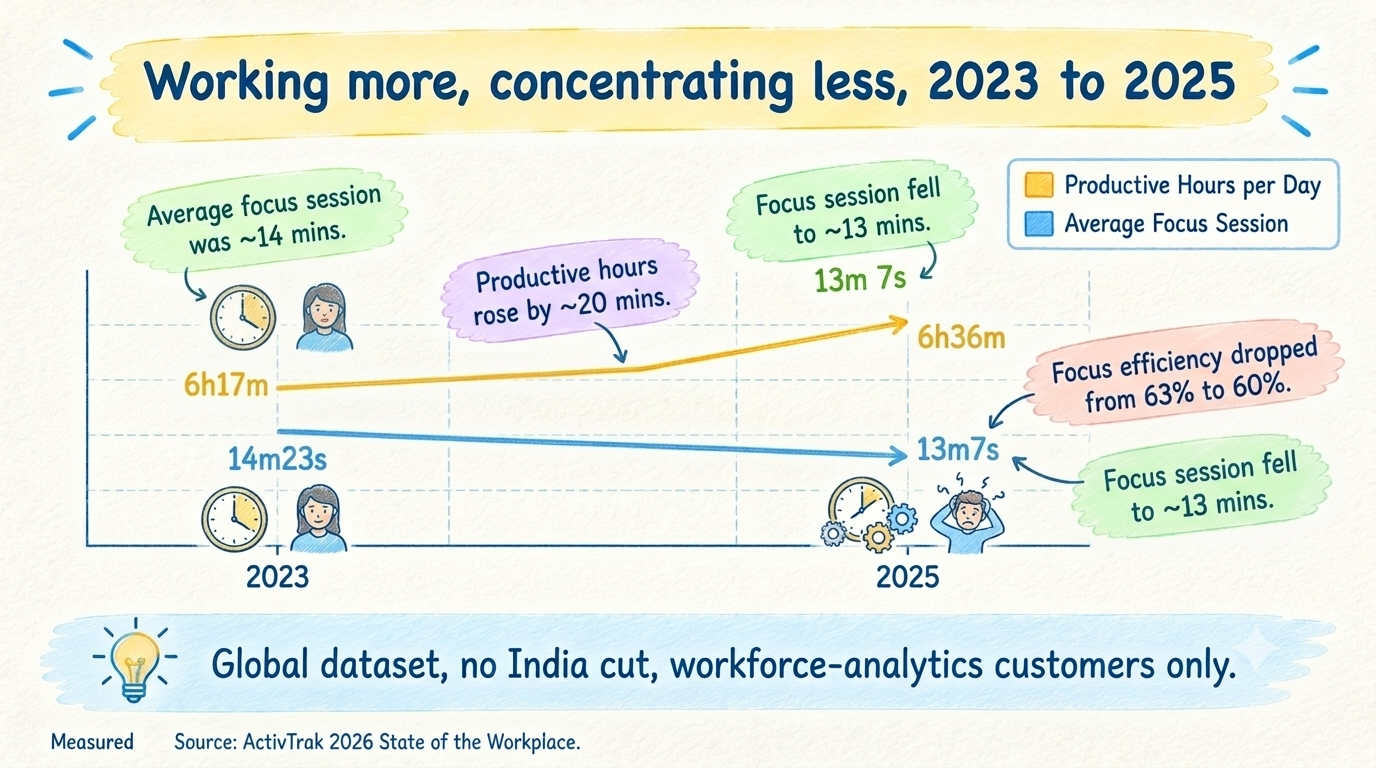
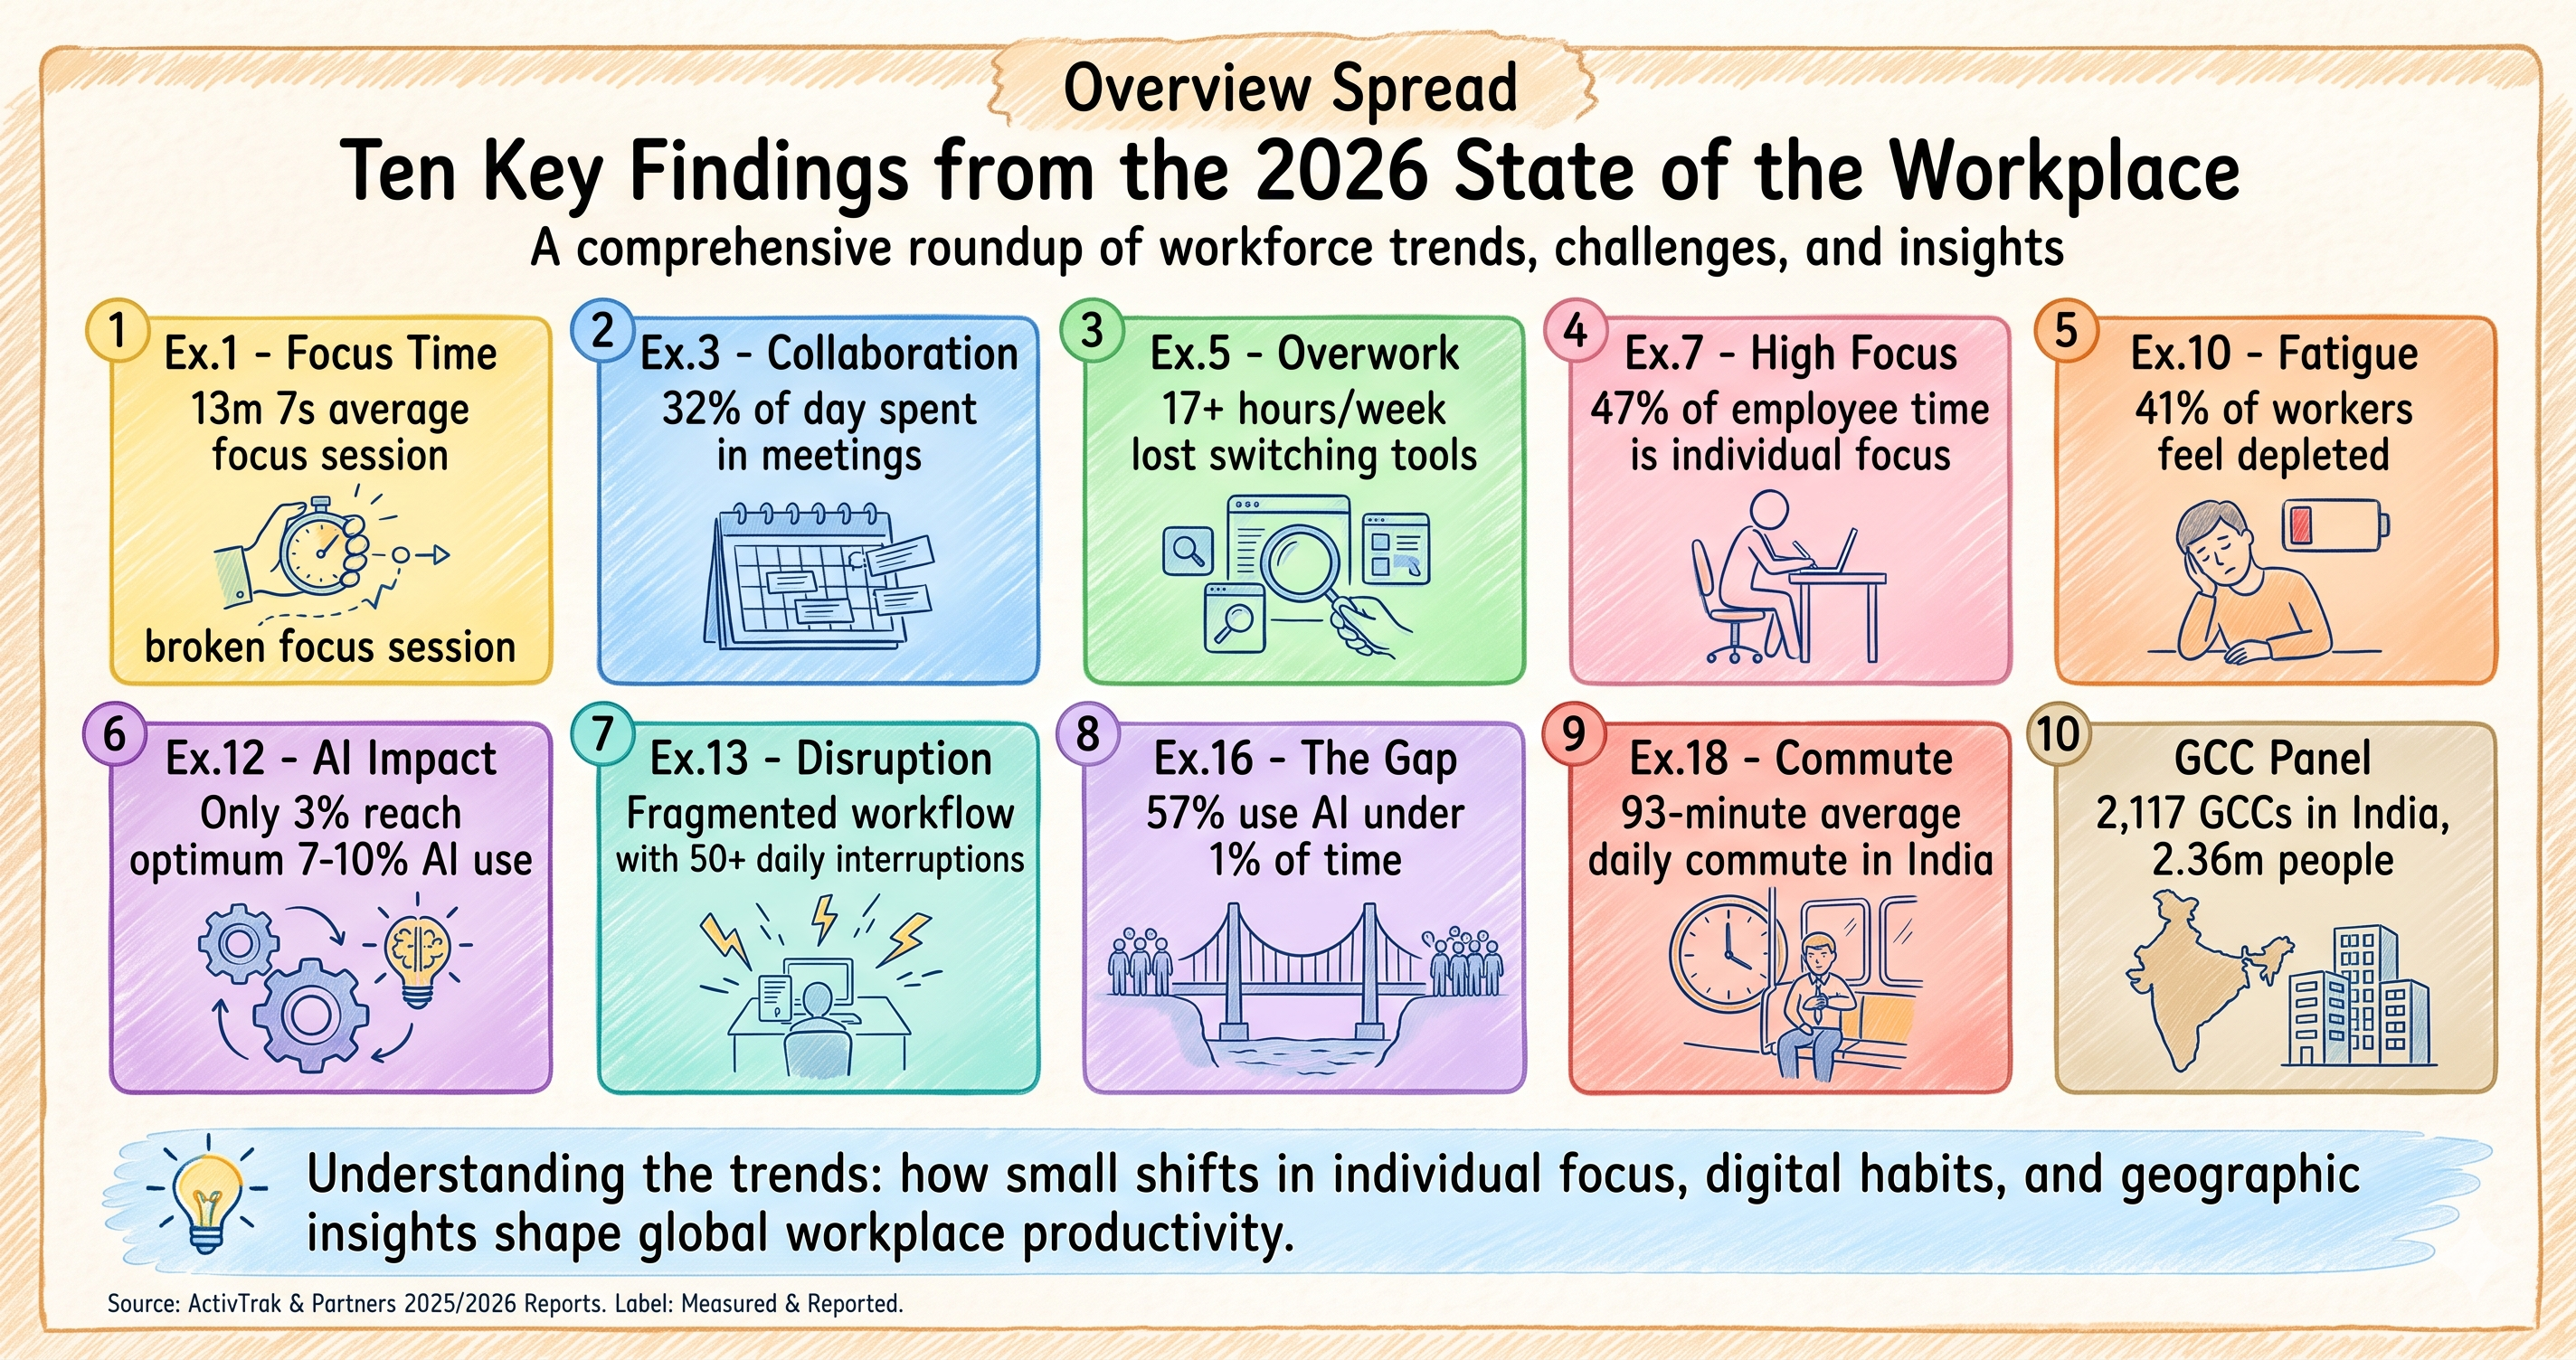
Even though daily productive time has risen to 6 hours and 36 minutes, deep concentration is taking a hit. Uninterrupted focus sessions have shrunk from 14 minutes and 23 seconds down to just 13 minutes and 7 seconds, pulling focus efficiency down to 60% - showing that people are working more while concentrating less (Source: ActivTrak, 2026 State of the Workplace).
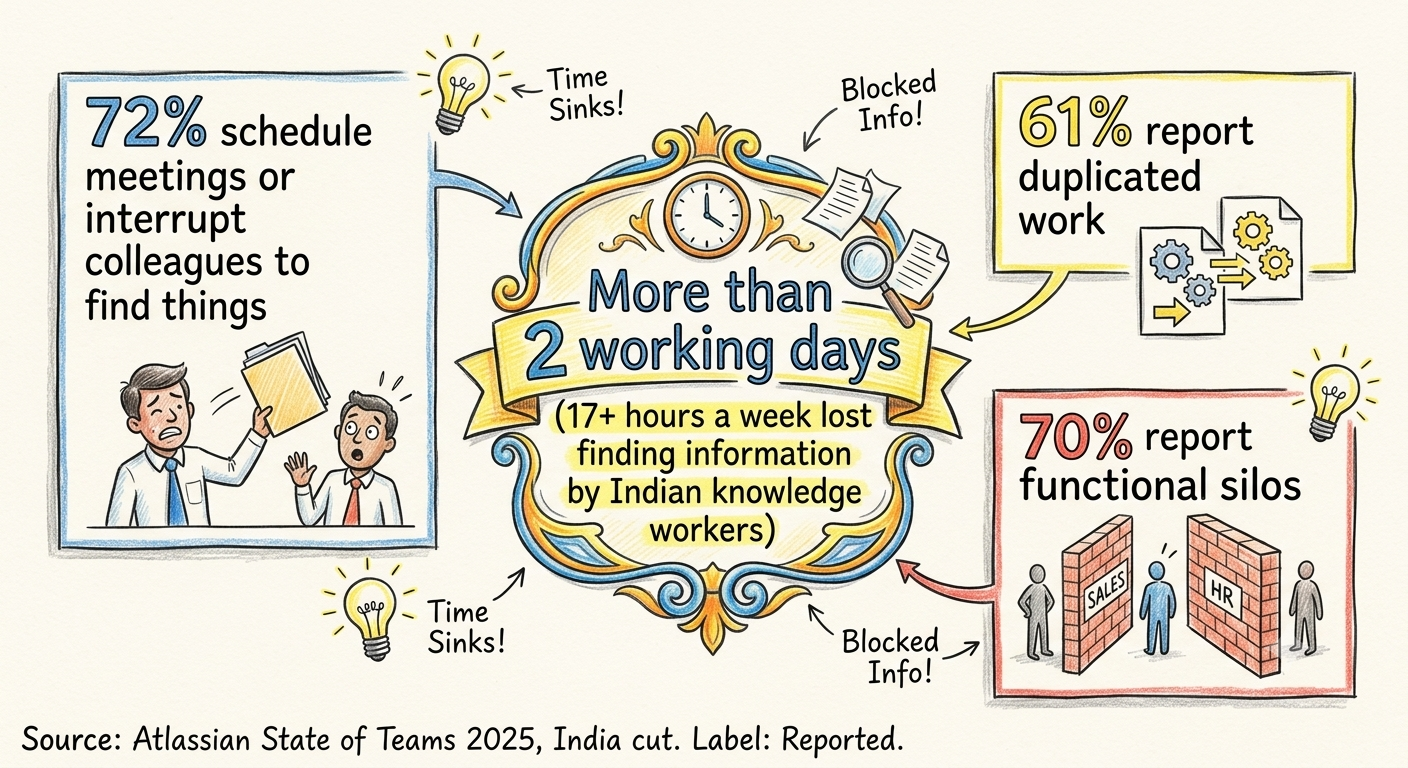
A major reason for this is information clutter is that Indian employees lose over 17 hours a week just searching for what they need. To get quick answers, 72% resort to interrupting a coworker or scheduling a meeting, while another 61% report that teams are quietly repeating work that’s already been done (Source: Atlassian, State of Teams 2025).
AI has so far turned out to be an engine that fragments. This is because eighty per cent of employees use it and it fills 0.8% of their hours, and after adoption chat volume rose 145% and email conversations by 104% while AI users' focus time fell 9%. Some 84.2% of them never get past shallow use at all. (Source: Microsoft, Work Trend Index 2026.)
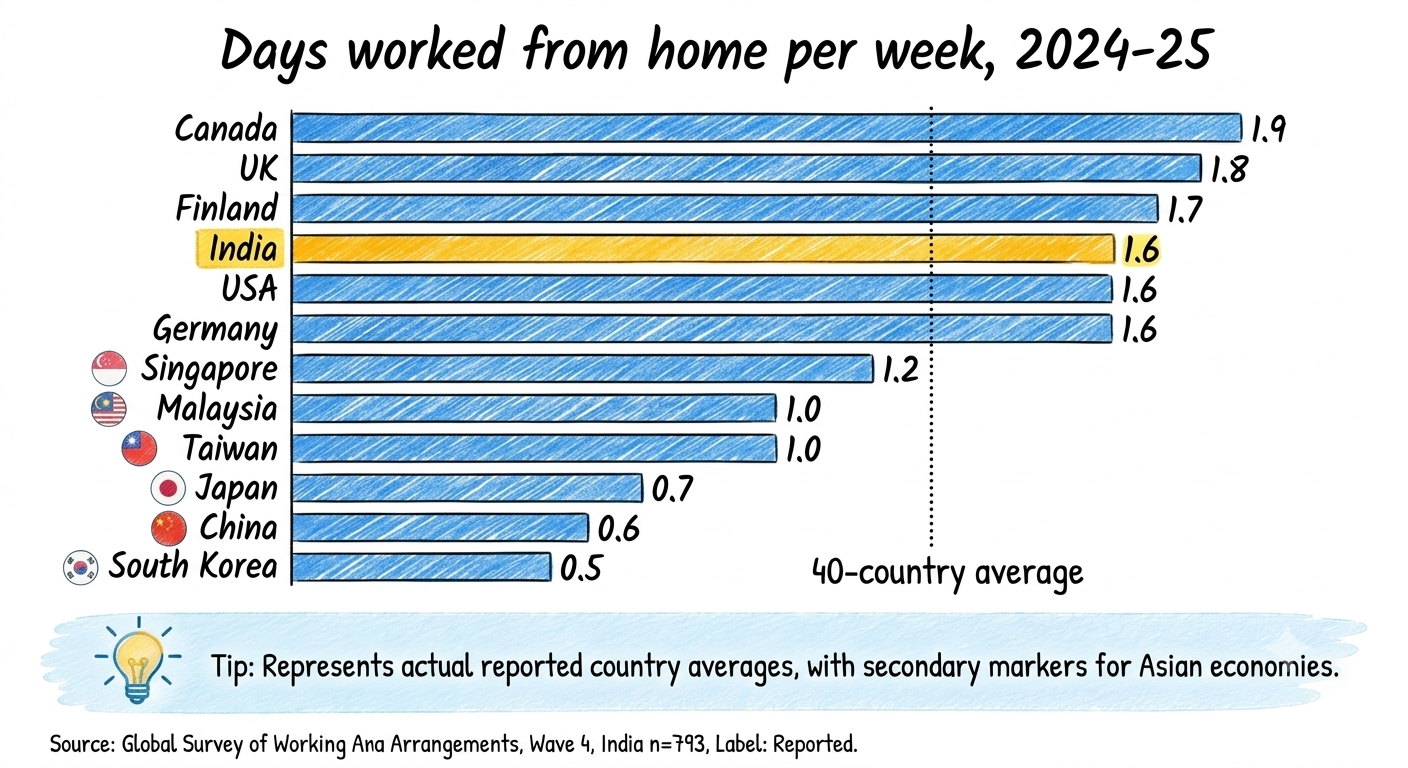
India is also not the low-remote economy it gets assumed to be, because employees here average 1.6 work-from-home days a week, which is the highest in Asia, level with the United States and above the 40-country average of 1.2. The largest randomised trial of hybrid work found no effect on performance or promotion and a 33% drop in attrition. (Source: Global Survey of Working Arrangements; Bloom et al., Nature, 2024.)
How was this report researched?
Every figure comes from a named published source, and has been verified after collation to the best of our ability.
Two pieces of the analysis here are new as far as we can tell. The first reads ILOSTAT figures at an occupation level so that we could test the long-hours claim directly, without leaning on national averages that put software engineers and subsistence farmers in the same bundle. The second piece assembles thirteen quarters of utilisation data out of audited Indian IT filings and treats it as productivity evidence, which we have not seen anybody do before.
The rest of it is synthesis, and we would rather label it that way than dress it up and pretend that it is something else that isn’t.
What this report is not
It is not primary research, and there is no representative Indian sample anywhere in it. Anyone who needs those things should treat this as a map of what is currently knowable about Indian productivity, and we think that map is worth having even with the gaps in it.
Five limitations worth reading before the charts
Informality pushes India's national average down instead of up, which is surprising to most people. Skilled agricultural workers put in 36.6 hours a week, and because farm and self-employed work covers such a large share of Indian employment, the national figure of roughly 45 hours actually understates what white-collar workers in India do. Every knowledge related work claim in this report uses occupation-level or urban salaried data for that reason.
Our own internal statistics disagree with the international ones. The Periodic Labour Force Survey reports 42.2 hours a week for all workers, while ILOSTAT reports 45.5 for the same period and cites the PLFS as its source, so the two understand it differently. We name whichever one we are using for a given claim and don’t split the difference between them.
Output-per-hour comparisons do not transfer to knowledge workers, and this is the figure most likely to be misused by anyone quoting us. India's GDP per hour worked comes to roughly a tenth of the American number, but that gap is mostly capital intensity and sector mix inside an average that also includes subsistence farming (India being a largely agrarian country). It tells you nothing about whether an Indian engineer produces less per hour than an American one, and we do not use it to suggest anything of the kind since that isn’t the purpose of this report.
The behavioural data comes from companies that agreed to be monitored. Chapters 3, 6 and 7 lean on workforce-analytics vendors whose datasets only contain organisations that installed monitoring software and then kept it running, which probably skews the picture towards large, process-heavy employers. These vendors disclose their sample sizes but mostly not their sample composition, and none of the data pertains to the Indian context.
Measured behaviour and self-reported experience never get combined anywhere in this report, and every figure carries its method so that you can see which is which.
Three things we could not find
Our brief asked for three things that simply do not exist as Indian data, and saying so seemed more useful to us than improvising something that looked convincing.
The first is application-level usage. Nobody publishes India-cut data on which software people use at work or how long they spend inside it, and the one provider that used to rank work applications by real sign-in data dropped that ranking in 2026, having never included India in its regional breakdowns anyway. Chapter 4 reports the category-level survey data that does exist for India, alongside organisation-level tool counts that are global only.
The second is interruption telemetry for India, where the major sources publish global aggregates and nothing else. One large survey does carry an India cut and Chapter 6 makes what use of it it can.
The third is the work-model split of Indian job postings. No published source gives the remote, hybrid and onsite composition of Indian job advertisements, our largest job platform does not publish that cut, and the main international remote-postings dataset leaves India out entirely. Chapter 5 instead works from employee survey data that is already available.
Chapter 1: Do Indian employees actually work too few hours?
No. Indian managers average 57.2 hours a week, which is roughly 16 more than managers in the United States. (Source: ILOSTAT occupation-level hours data, 2025.)
In October 2023, Infosys co-founder N. R. Narayana Murthy said on a podcast that he would like young Indians to work 70 hours a week, and added that India's work productivity "is one of the lowest in the world." Fifteen months later, in January 2025, Larsen & Toubro chairman S. N. Subrahmanyan was recorded telling his employees that "if you have got to be on top of the world, you have to work 90 hours a week."
Both remarks were criticised heavily. We don't think either man was wrong to be worried about Indian productivity, and anyone who has run a team here has probably felt some version of that same worry. What we would question is the diagnosis, because both statements assume the same chain of reasoning, which runs that our output is low, so our effort must be short, so more hours ought to close the gap. When we went looking for evidence of that first premise, we actually found the opposite of it.
The occupation data answers this fairly directly
Most comparisons of Indian working hours use national averages, and that is really where the confusion starts, because as earlier flagged, national average puts software engineers and agricultural farmers into the same frame. The International Labour Organization also publishes hours by occupational group, built on the same basis across countries, and that gives us a much fairer test of what white-collar India actually does.
Indian managers work 57.2 hours a week, professionals work 51.6, technicians and associate professionals work 54.0, and clerical support staff work 56.3. The same four figures for the United States are 41.3, 38.1, 37.7 and 36.1.
An Indian manager is therefore already working about sixteen hours a week more than an American one, which comes to two extra working days every week, happening now, without anybody having to ask for it. We ran the same comparison against Germany, the United Kingdom, South Korea, Brazil, Mexico and Indonesia, and Indian white-collar hours came out highest every single time.
Nearly half the workforce is already past the line
The ILO treats 49 hours a week as the point at which working time becomes excessive, and using its employment-by-hours-band data we calculate that 48.8% of Indian workers, which is roughly 232 million people, were above that line in 2025. The share has been coming down, though only slowly, from 50.5% in 2023 and 50.1% in 2024.
What makes the number striking is the comparison around it. Mexico sits at 23.1%, Indonesia at 21.9%, South Korea at 15.5%, the United States at 11.3%, Brazil at 9.4%, the United Kingdom at 8.5% and Germany at 4.2%. We are not slightly ahead of our peers on this measure, because we are running at roughly four times the American rate and more than ten times the German one.
That particular figure is ours and not the ILO's, so we should say how we got it. We took the ratio of the "49 hours and above" band to the total from the ILOSTAT data series EMP_TEMP_SEX_HOW_NB_A, which means anyone who wants to check our working can rebuild it in a few minutes.
India also records the highest annual hours per worker of anyone in its comparator set, at 2,383 hours a year, against China's 2,328, America's 1,789 and Germany's 1,335.
Utilisation suggests there isn't much left to give
The number of hours tells you how long somebody is working, which is fairly useful but quite limited, whereas utilisation tells you how much of their billable work had them working with their available capacity. Indian IT companies happen to disclose exactly that, every quarter, in audited reports for their investors. For a country with very little verifiable productivity data, that makes it unusually valuable, and as far as we can tell nobody has used it this way before.
Across the thirteen quarters from Q1 FY24 to Q1 FY27, Infosys reported utilisation excluding trainees between 81.1% and 86.0%, while Wipro, measuring on a similar though not identical basis, reported between 83.1% and 87.7%.
Anyone who has run a services business will recognise what those numbers are really saying. A services company is never able to bill every employee all the time. Training, leave, illness and bench time are unavoidable. So when utilisation sits in the mid-eighties year after year, it usually means the organisation is already operating close to its practical limit rather than leaving large amounts of capacity unused.
Infosys reports on consolidated IT services while Wipro reports on IT services excluding business process services, so the two series run close together without being strictly comparable. And only two of our four largest IT firms disclose the metric at all, since TCS and HCLTech have both stopped publishing it, which means this is not an industry-wide series and we would rather it wasn't described as one.
And engagement is going the other way
If we were to explain where the effort is being taken, we would expect to be looking at a workforce with something held in reserve, but the engagement data shows us closer to the opposite of that.
As in “What the Data Shows” outlined above, Gallup's 2026 State of the Global Workplace puts Indian employee engagement at 23%, where three years earlier the rolling figure was 33% and two years ago it was 30%. Only 17% of Indian workers count as ‘thriving’ in their lives overall, against a global figure of 34%, and 36% told Gallup they had felt sadness during a lot of the previous day, which is the highest of any region measured anywhere in the world. South Asia recorded the steepest regional fall in engagement of any region, along with the steepest fall in manager engagement, down eight points.
One number does stand out in those figures, and I think it matters quite a lot. Indian workers report less daily stress than the global average, at 28% against 40%, so this doesn't really look like a workforce under acute pressure. It looks more like a workforce putting in long hours without much sense that the hours are going anywhere, which is a different problem and needs a different answer.
We should note that Gallup's country figures are three-year rolling aggregates, so that ten-point fall compares overlapping windows and probably understates what happened in any single year.
The hours are already being worked, and the people working them are steadily running out of reasons to care. Whatever is holding Indian productivity back, we don't think a shortage of time at desks is the answer.
Chapter 2: What does a fragmented workday actually look like?
Fragmentation means the workday arrives in pieces that are too small to do any real appreciable work in.
Continuity is where we think the constraint sits, and work that keeps getting broken produces less than the same quantity of work left whole. The cost of that never shows up on a timesheet. Rebuilding context takes real time, partial attention introduces mistakes that have to be caught later, and decisions get pushed to tomorrow because no stretch of today was ever long enough to make them properly.
Hours will tell you how long somebody was available, and they say nothing at all about whether that availability contributed to productivity or not.
Why this is a diagnostic and not an index
We drafted a scored fragmentation index by industry and then we dropped it.
The component data for India does not exist. There is no Indian telemetry on meeting load, application switching or interruption rates, as the methodology sets out, so an index built by importing global numbers and printing them as Indian scores would look authoritative and mean almost nothing. Anyone who checked would find that out quickly, and they would be right to.
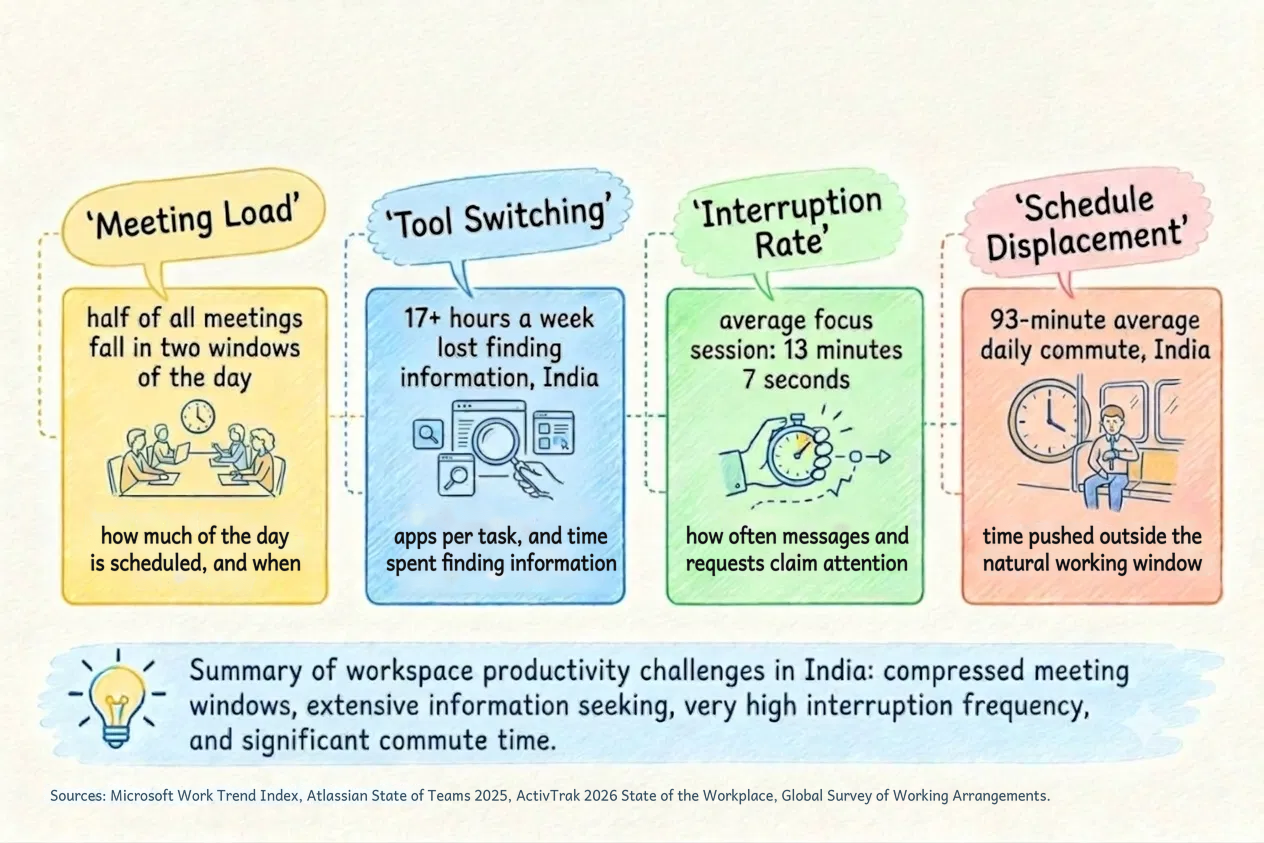
What follows instead is a four-part diagnostic. Each part has evidence behind it later in the report, and each one is something you can measure from data your organisation already holds.
Meeting load. How much of the day is committed to scheduled time, and where in the day does it sit? Concentration matters more here than volume, because four meetings scattered across a day can destroy more capacity than six stacked together, simply because the gaps between them are too short to start anything in or dedicate work to.
Tool switching. How many applications does one task require, and how much time goes into finding information instead of using it? Somebody who cannot find a document becomes an interruption in three other calendars, which is how fragmentation spreads through a team.
Interruption rate. How often does attention get claimed by messages, notifications, ad hoc requests and unscheduled meetings, and what share of all that arrives outside working hours?
Schedule displacement. How much of the working day falls outside the employee's natural window, whether through timezone overlap, shift patterns, or time spent getting to and from the office?
That fourth one is where India diverges hardest from the economies we get compared against, and it is also the one that almost nobody measures.
Appendix A sets out the questions we would ask to score each part. We made it reproducible on purpose.
Chapter 3: How many hours a day do employees actually work?
The largest available telemetry puts productive time at 6 hours 36 minutes a day, and no Indian equivalent exists. (Source: ActivTrak, 2026 State of the Workplace — global telemetry; no India-specific figure exists, as noted below.)
For India specifically the honest answer is that nobody knows, and any report handing you a precise figure is quoting something that will not survive a second look.
Numbers like "Indian employees are productive for only two hours and fifty-three minutes a day" get circulated a great deal, without any real backing except that they come from employee-monitoring vendors measuring their own customers, which is a self-selected group of firms that chose to install surveillance software and tends to skew large and process-heavy. Those are not national statistics and we should probably stop treating them as though they were.
Here is what the biggest datasets do measure, with the limitations attached to them.
Across 1,111 companies and 163,638 employees covering more than 443 million hours between January 2023 and December 2025, productive time averaged 6 hours 36 minutes a day, which was up 5% over the period. Total workday span shortened slightly over those same three years, from 8 hours 53 minutes to 8 hours 44 minutes. The dataset is global and India doesn’t have a specific cut in it.
More productive time inside a shorter day sounds, on the face of it, like an improvement.
The number underneath the headline
The same dataset recorded something else across those three years. Average uninterrupted focus sessions fell from 14 minutes 23 seconds to 13 minutes 7 seconds, which is a drop of 9%, and focus efficiency went from 63% to 60%. Multitasking climbed 12% to 1 hour 33 minutes a day, and collaboration time rose 34% to 52 minutes, which now eats 13% of all productive hours.
Weekend work went up sharply as well, with Saturday productive hours rising 46% and Sunday 58%, while employees flagged at risk of disengagement went from 19% to 23%.
So productive time is going up while the quality of that time comes down. People are working more hours, in smaller pieces, across more days of the week, and disengaging while they do it. Which seems to be part of a larger problem industries face today.
That is the central claim of this report, and it comes from a vendor with every commercial reason to have reported the reverse.
A warning about the words
"Productive time", "focus time" and "healthy utilisation" are all vendor constructs, and no standards body has a definition for either of them.
Focus time is really a screen-activity proxy, because it counts stretches without an application switch or an interruption, which is a long way from having any real cognitive depth. Total time means time in front of a computer, so every efficiency ratio built on it leaves out offline work completely (anything that doesn’t require a computer basically and cannot be ‘tracked’. And the thresholds for overutilisation and burnout risk get configured by whoever bought the software in the first place.
These figures are useful for tracking movement inside one dataset over time, they cannot be compared across vendors, and they do not measure human productivity in any general sense.
Chapter 4: Which applications do Indian employees use at work?
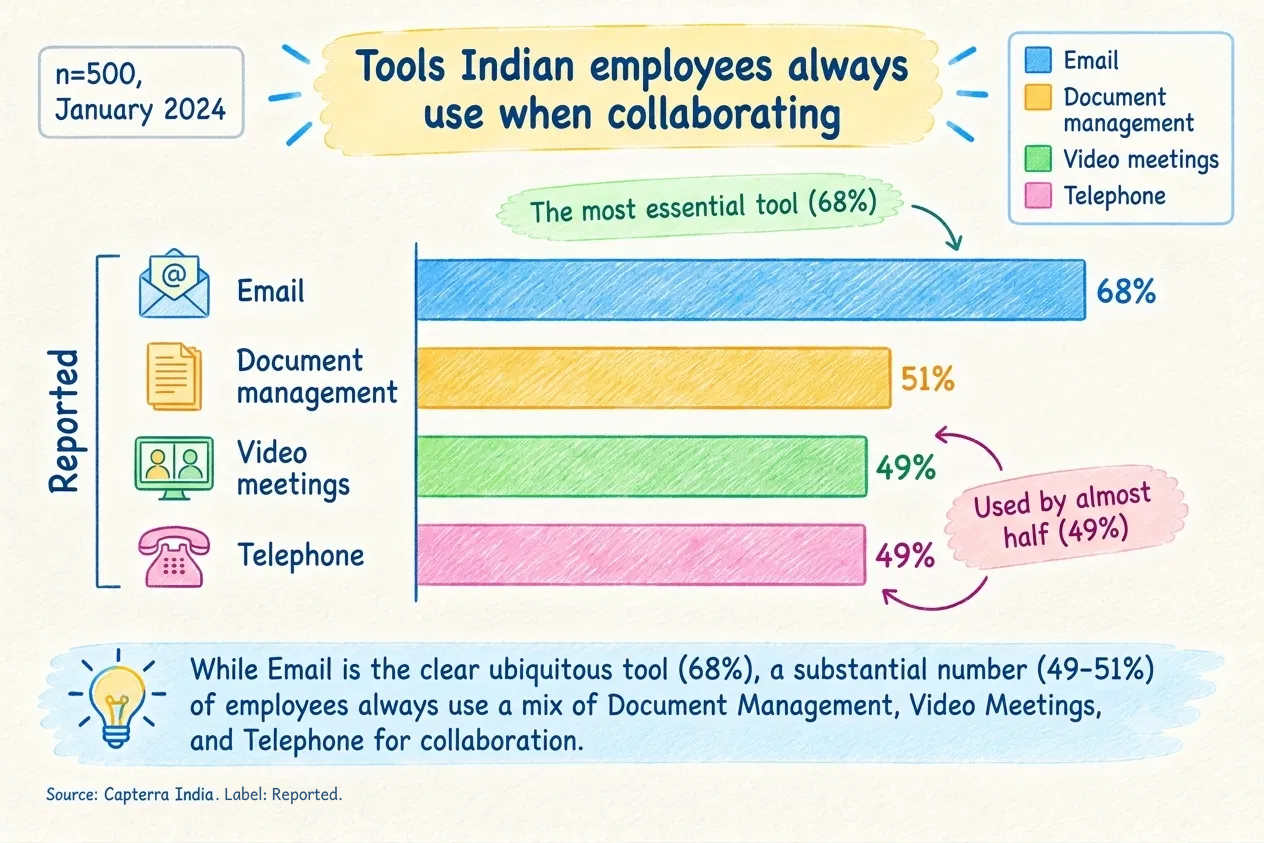
Email leads at 68%, followed by document tools at 51% and video meetings at 49%, on a 500-person Indian sample. (Source: Capterra India workplace collaboration survey, n=500, January 2024.)
It is a reality today that nobody publishes India-specific data on which applications people use at work or how long they spend in each of them. The single provider that used to rank work applications by actual sign-in data discontinued that ranking in 2026, and India was never in its regional breakdowns to begin with, so this report contains what facts that we were able to collate.
Category-level usage in India
A survey of 500 India-based remote and hybrid employees, fielded in January 2024, asked what they always use when collaborating. Email back-and-forth was at 68%, document management tools such as Google Docs or Microsoft 365 were at 51%, video meetings at 49% and phone calls also featured at 49%. On meeting features, screen sharing topped the list at 62%, then came in-meeting chat at 55% and content sharing at 54%.
It is a small sample where the fieldwork is now eighteen months old, and the panel was not built to be nationally representative. It is still the only India-specific application data we could verify, which tells you something in itself about the state of evidence available here.
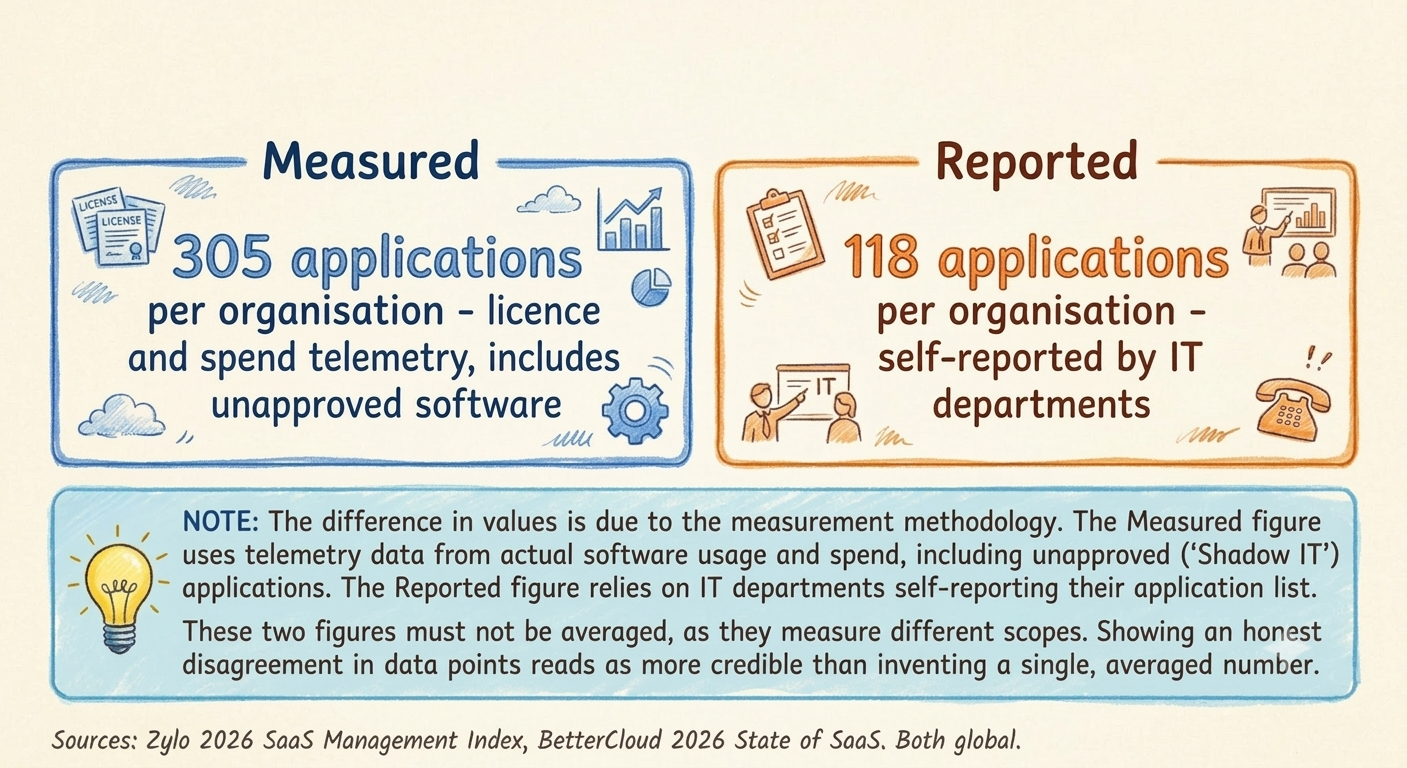
Two credible sources estimate how many software applications organisations use, but they arrive at very different numbers. Zylo's 2026 SaaS Management Index reports an average of 305 applications per organisation (with a median of 240), while BetterCloud's 2026 State of SaaS reports 118 applications, based on a survey of 525 IT professionals. (Source: Zylo, 2026 SaaS Management Index; BetterCloud, 2026 State of SaaS.)
The difference comes largely from how the two datasets are built. Zylo analyses licence and software-spend telemetry across more than 40 million licences, allowing it to detect every application it can find, including software purchased outside IT's approval process. BetterCloud, by contrast, relies on what IT departments report they manage. Both datasets are global rather than India-specific, but they are measuring different things. One captures the software that exists across an organisation, while the other captures the software IT knows about. That is why the figures differ so substantially, and why averaging them would produce a number that represents neither dataset.
They do agree on one direction of travel, which is that AI-capable software is multiplying fast. One dataset shows AI-native spend up 108% year on year and usage of AI-category applications up 181%, while the other counts 27 AI-capable applications per organisation, which comes to about 22% of the software estate.
We didn’t find any credible data for applications used per employee. Any figure from that should be treated as unverified, including numbers sometimes quoted from workforce-analytics vendors, which usually count AI tools per organisation and not applications per person.
Chapter 5: Is India a work-from-home economy or an office economy?
Indian employees average 1.6 work-from-home days a week, which is the highest in Asia and level with the United States. (Source: Global Survey of Working Arrangements, Wave 4.)
The Global Survey of Working Arrangements covers full-time, college-educated employees across roughly forty countries, and its most recent wave puts India at 1.6 days. That leads Asia by a wide margin, with Singapore at 1.2 days, Malaysia and Taiwan at 1.0, Japan at 0.7, China at 0.6 and South Korea at 0.5. India ties the United States at 1.6 and trails only Canada at 1.9, the United Kingdom at 1.8 and Finland at 1.7, where the forty-country average sits at 1.2.
India's sample was 793 respondents from an online panel of full-time, college-educated employees aged 20 to 64, so it describes urban graduate India and not the workforce as a whole, which happens to be exactly the right population for a question about knowledge work.
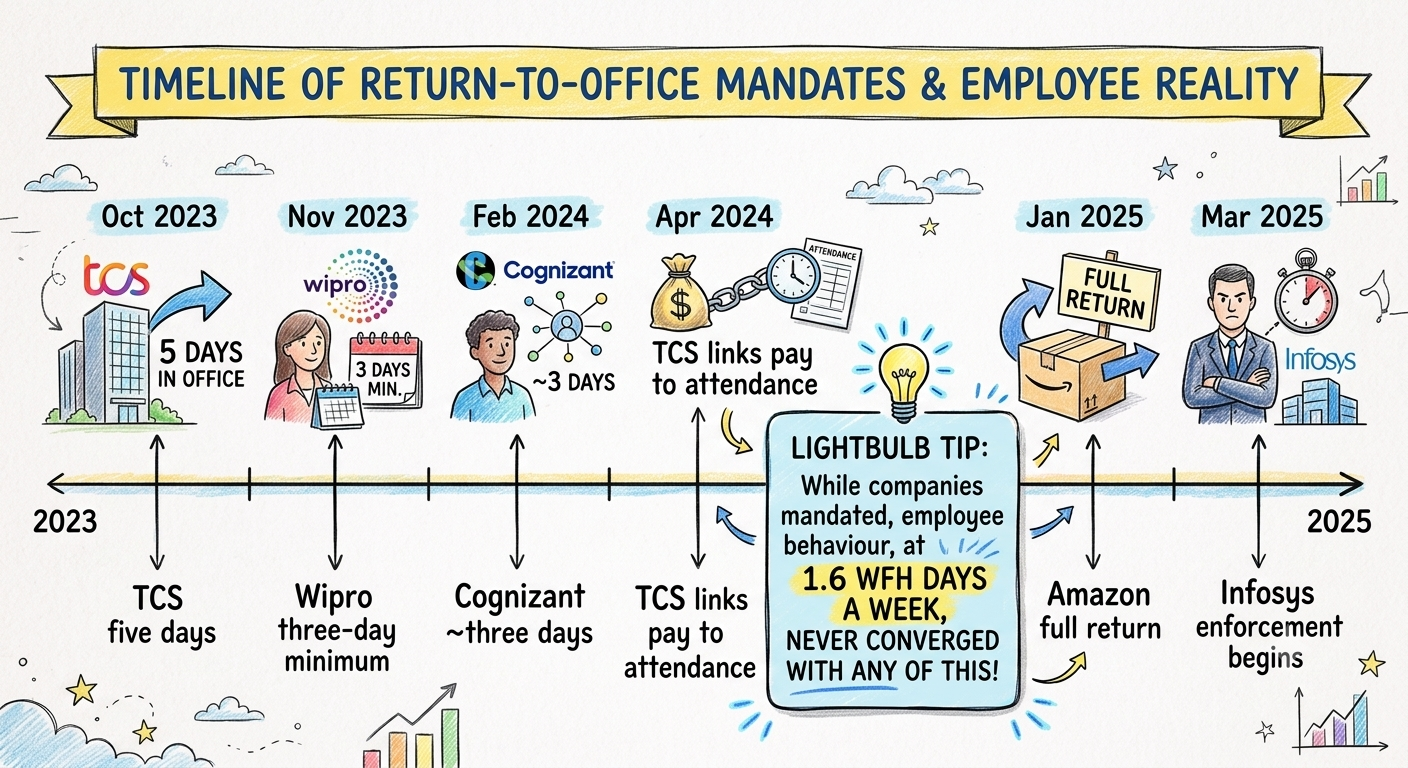
We get grouped with East Asia as a presence-oriented, low-remote work culture, and the data has been saying otherwise for a while now.
Employers went the other way
Indian mandates have moved hard in the opposite direction. Tata Consultancy Services required five days in the office from October 2023, then tied variable pay to attendance and capped exceptions at six days a quarter. Wipro set a three-day minimum from November 2023, Infosys required ten days a month and began enforcing it through attendance-system controls in March 2025, Cognizant told Indian staff to expect about three days a week from February 2024, and Amazon returned to a full five-day expectation in January 2025.
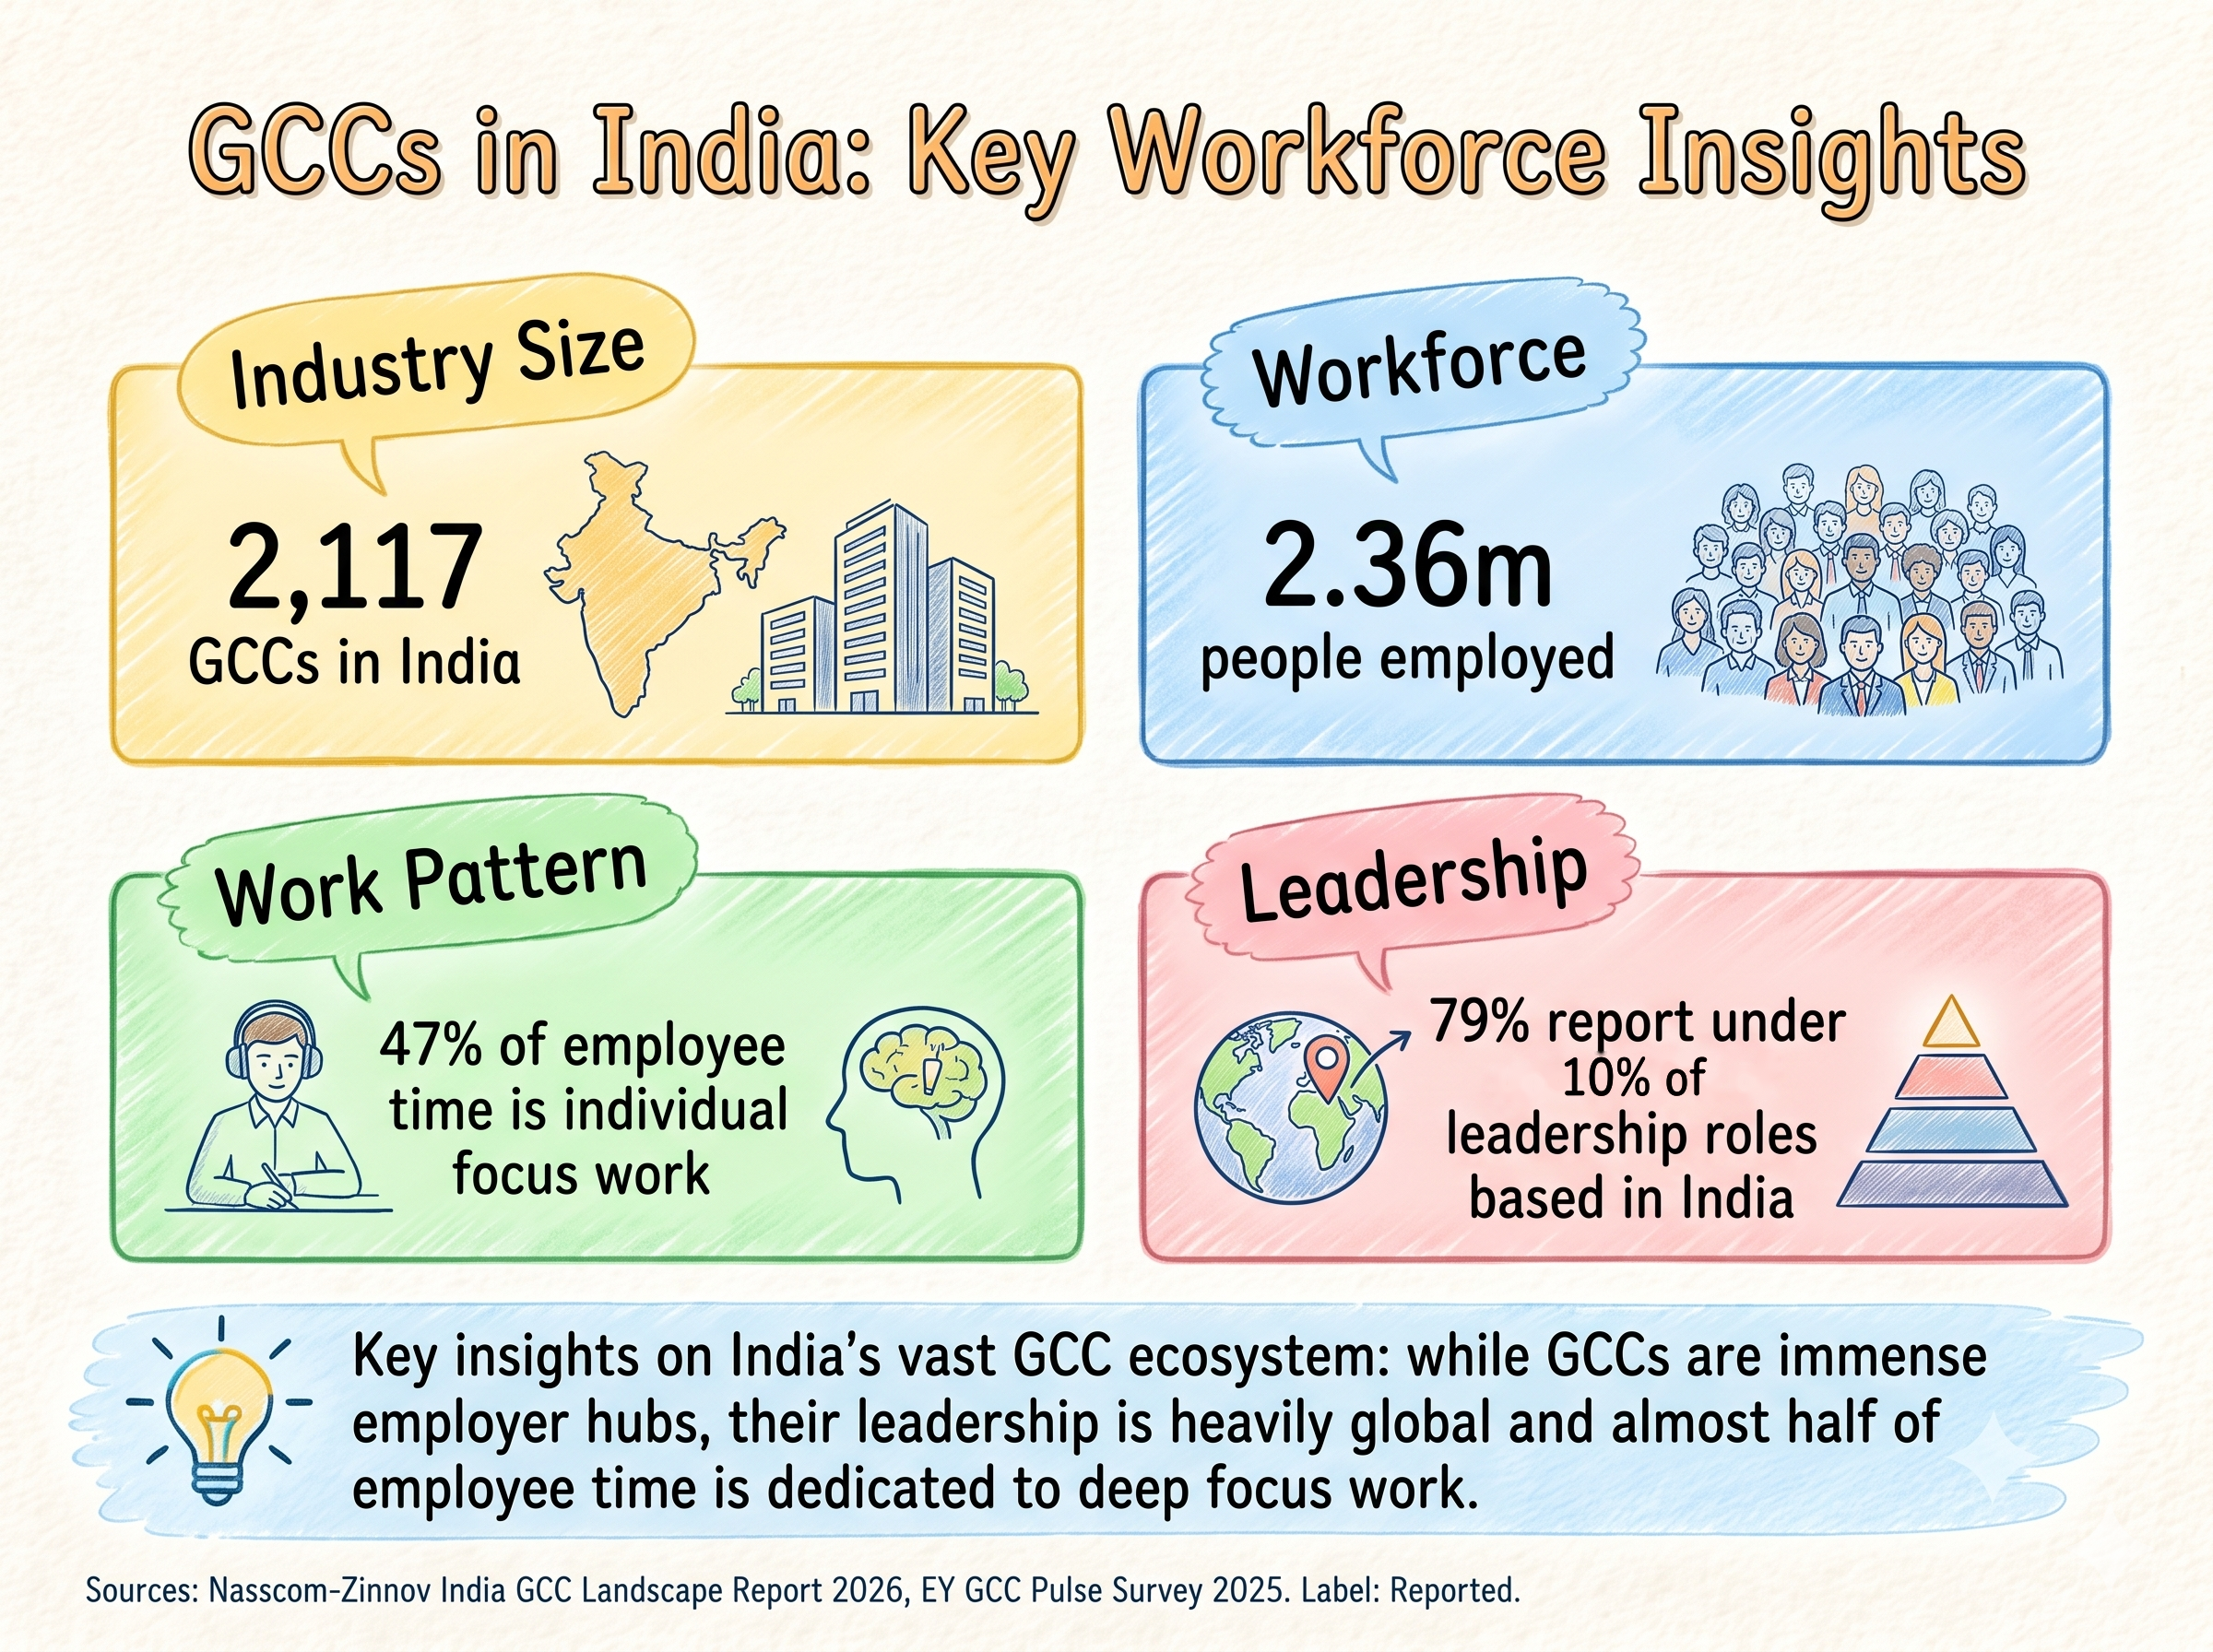
Global capability centres went a different route, and more than 2,100 of them now employ some 2.36 million people here with 95% running hybrid arrangements.
The strongest causal evidence we have on hybrid work comes from a randomised controlled trial of 1,612 graduate employees, assigned by birth date to either two work-from-home days a week or five days onsite, and then tracked for up to two years.
There was no statistically significant effect on performance reviews or promotions, and the researchers tested for equivalence instead of simply failing to find a difference, which is a considerably stronger claim. There was no effect on code output either. Attrition fell by a third, from 7.2% to 4.8%, with a much larger drop among women and among employees with long commutes, and satisfaction rose measurably.
Managers had predicted that hybrid work would cut productivity by 2.6%, and after running the experiment those same managers estimated it had raised productivity by 1.0%.
The trial ran in China, no Indian equivalent exists, and no causal study of remote or hybrid work in India has been published at all, so the finding travels imperfectly and we would not want to oversell it. The direction is still clear enough to say out loud, which is that on the best evidence available, where people work turns out to be a retention question and not a productivity one.
Four years of argument about location, then, while the fragmentation problem went largely unexamined.
The variable that does matter here
Where Indian employees work matters enormously for one reason that has almost nothing to do with work culture.
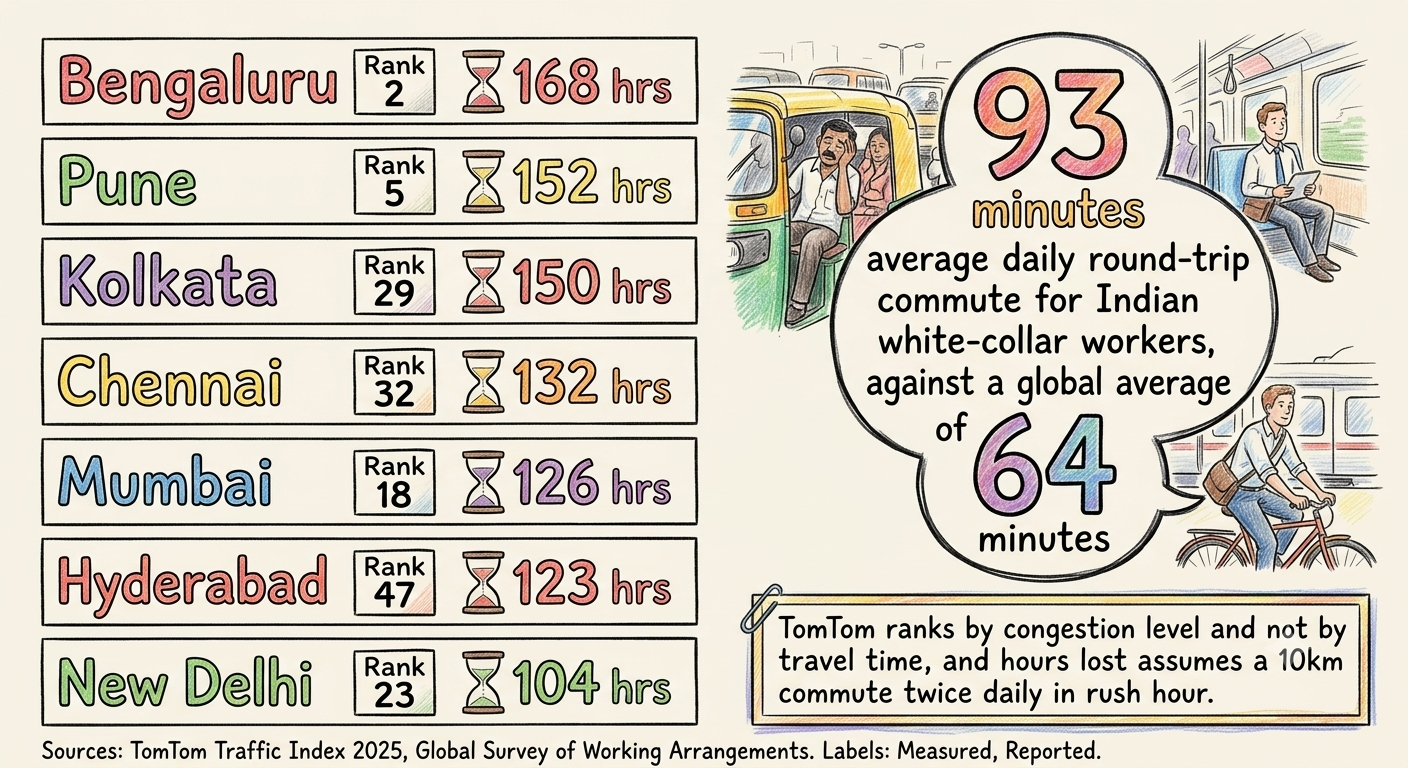
Indian white-collar workers report an average round-trip commute of 93 minutes a day, where the global average is 64 and the United States manages 48. Among major economies only China, at 96 minutes, runs higher than we do. (Source: TomTom Traffic Index 2025.)
The traffic data explains why. In the 2025 TomTom Traffic Index, Bengaluru ranked second worst in the world for congestion, at 36 minutes 9 seconds to cover ten kilometres and 168 hours lost to rush-hour delay per year, with Pune coming fifth. Mumbai, Delhi, Kolkata, Chennai and Hyderabad all sit inside the global top fifty.
A five-day office mandate in Bengaluru commits each employee to roughly seven and a half hours a week in traffic, which is time that counts as neither work nor rest - almost an entire work day. It lands squarely in schedule displacement, the fourth part of our diagnostic, and no productivity case for the mandate really survives without accounting for it.
Chapter 6: What actually breaks focus at work in India?
Indian knowledge workers lose more than 17 hours a week searching for information they need. (Source: Atlassian, State of Teams 2025 — 12,000 knowledge workers across six markets, India cut.)
The clearest India-specific evidence of fragmentation we found concerns information retrieval, and the figure is large enough to reframe the whole problem.
A survey of 12,000 knowledge workers across six markets including India found Indian respondents losing over 17 hours a week to scouting for information or other things relating to work, which is two working days gone every week. Seventy-two per cent said they often schedule a meeting or interrupt a colleague purely to locate something, another 61% reported teams unknowingly duplicating work that had already been finished elsewhere, and 70% said functions operate in isolated silos. Ninety-one per cent thought AI could be doing more of this than it currently does, which strikes me as the most verifiable number in the report.
Two parts of our diagnostic collide here, because time disappears into tool switching and the search itself then generates interruptions for everybody nearby.
We verified these India figures through Indian trade press reproducing the publisher's India release and not from the report itself, and the India subsample size is not disclosed, so both need confirming before the number gets quoted onward.
The global interruption picture, read carefully
Interruption frequency has no India-specific data at all. What we do have is global telemetry, and one of its most quoted statistics is also one of its most misunderstood.
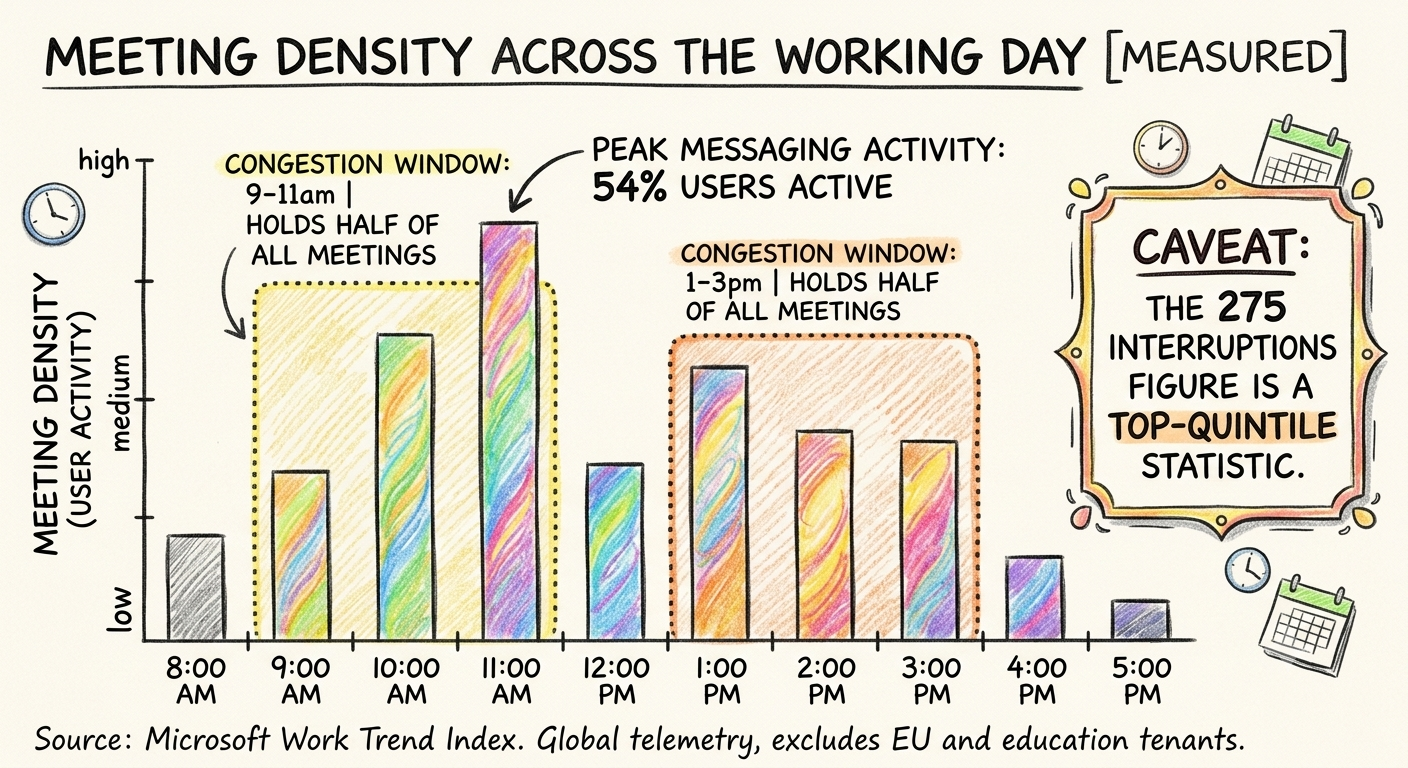
You have probably seen the claim that knowledge workers get interrupted every two minutes, or 275 times a day. That isn't the average employee. It describes only the busiest 20% of users by message volume. Even then, the "every two minutes" figure assumes an eight-hour workday, while the 275 interruptions are counted across an entire twenty-four-hour period. Putting those two together as if they describe a typical day paints a much more dramatic picture than the underlying data actually supports.
The broader workforce still faces a heavy communication load. On a typical weekday, employees receive around 117 emails and 153 chat messages. Half of all meetings are squeezed into just two windows, between 9-11am and 1-3pm, with 11am emerging as the busiest hour of the day. Between 57% and 60% of meetings are also arranged without a calendar invite, leaving employees to constantly react instead of plan.
None of these numbers look alarming in isolation. Together, they explain why long stretches of uninterrupted work have become so rare. The problem is not simply the number of meetings or messages. It is how they are distributed throughout the day, repeatedly breaking concentration before people have enough uninterrupted time to finish meaningful work.
One measure captures fragmented work better than any aggregate we have seen, which is that edits to presentation files rise 122% in the final ten minutes before a meeting starts.
Meetings after 8pm rose 16% year on year, and around 30% of meetings now cross time zones, which matters disproportionately for our 2,100-plus global capability centres, where 79% report fewer than one in ten leadership roles based in India. Overlap with an overseas head office is structural there and not occasional. (Source: Nasscom-Zinnov, India GCC Landscape Report 2026; EY Global Capability Center Pulse Survey, 2025.)
On the self-reported side, 48% of employees and 52% of leaders describe their work as chaotic and fragmented, and one in three say the pace of the last five years has made it impossible to keep up. That survey included roughly 1,000 Indian respondents, though no India breakdown was published separately. (Source: Atlassian, State of Teams 2025 — likely source; original draft did not name one, flagged for confirmation.)
Chapter 7: Is AI making Indian employees more productive?
Not so far and the data backs the same. After AI adoption, chat volume rose 145% and email 104%, while focus time fell 9%. (Source: Microsoft, Work Trend Index 2026 — survey of 20,000 AI users across 10 markets including India.)
This is the chapter we did not expect to be writing.
Adoption is nearly universal and almost entirely shallow
Eighty per cent of employees in the largest available workplace dataset now use AI tools at work, up from 53% two years earlier, and monthly retention among users runs at 92%. Organisations have gone from two AI tools on average to seven, with 83% now running six or more of them.
AI accounts for 0.8% of total working hours, which is eight times the 0.1% of two years ago and still under one per cent of the day.
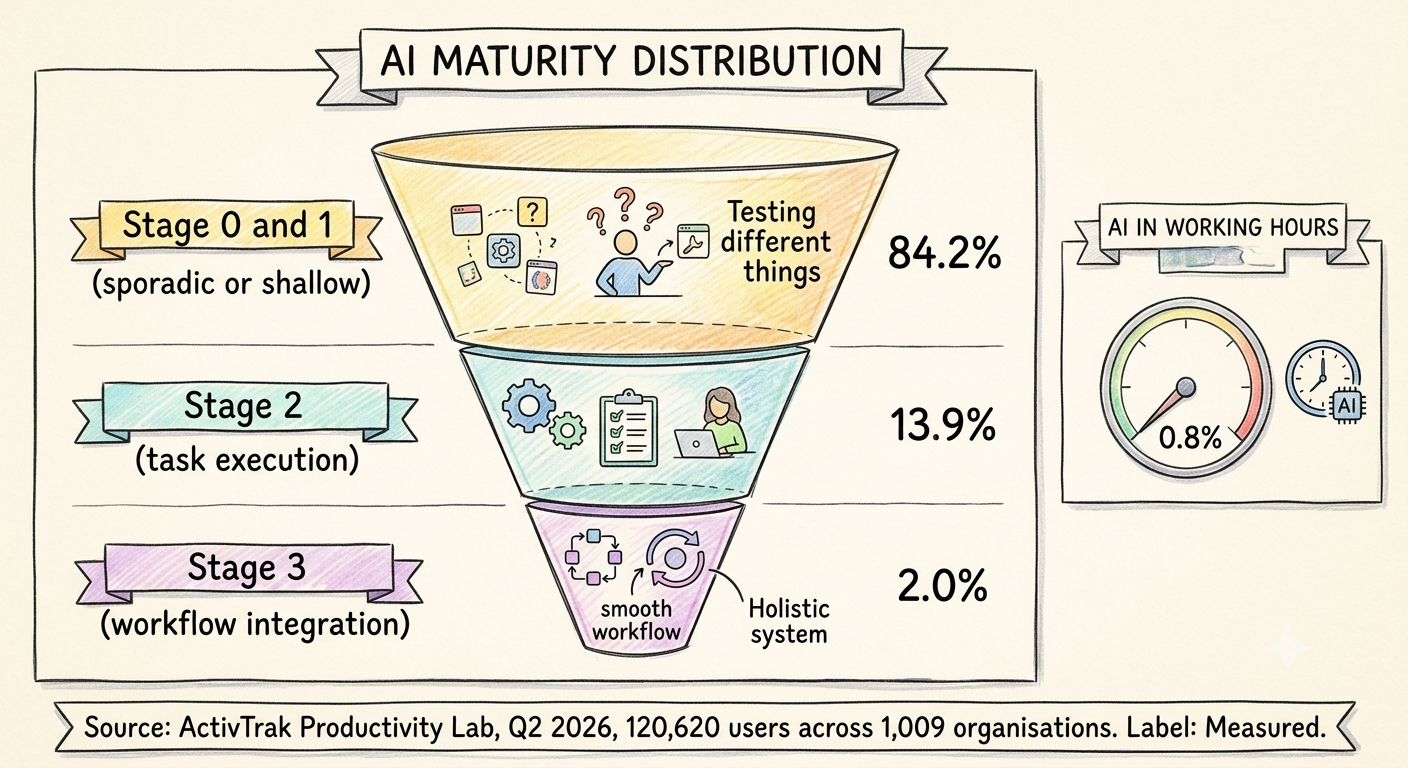
A mid-2026 analysis tracking a continuous cohort of 120,620 users across 1,009 organisations found 84.2% of employees sitting at the two shallowest stages of AI maturity, meaning either sporadic use or regular use with almost no engaged time inside the tool. Two per cent have reached genuine workflow integration, though that group did grow 36% in a single quarter. (Source: ActivTrak Productivity Lab, Q2 2026.)
Where the absorbed work went
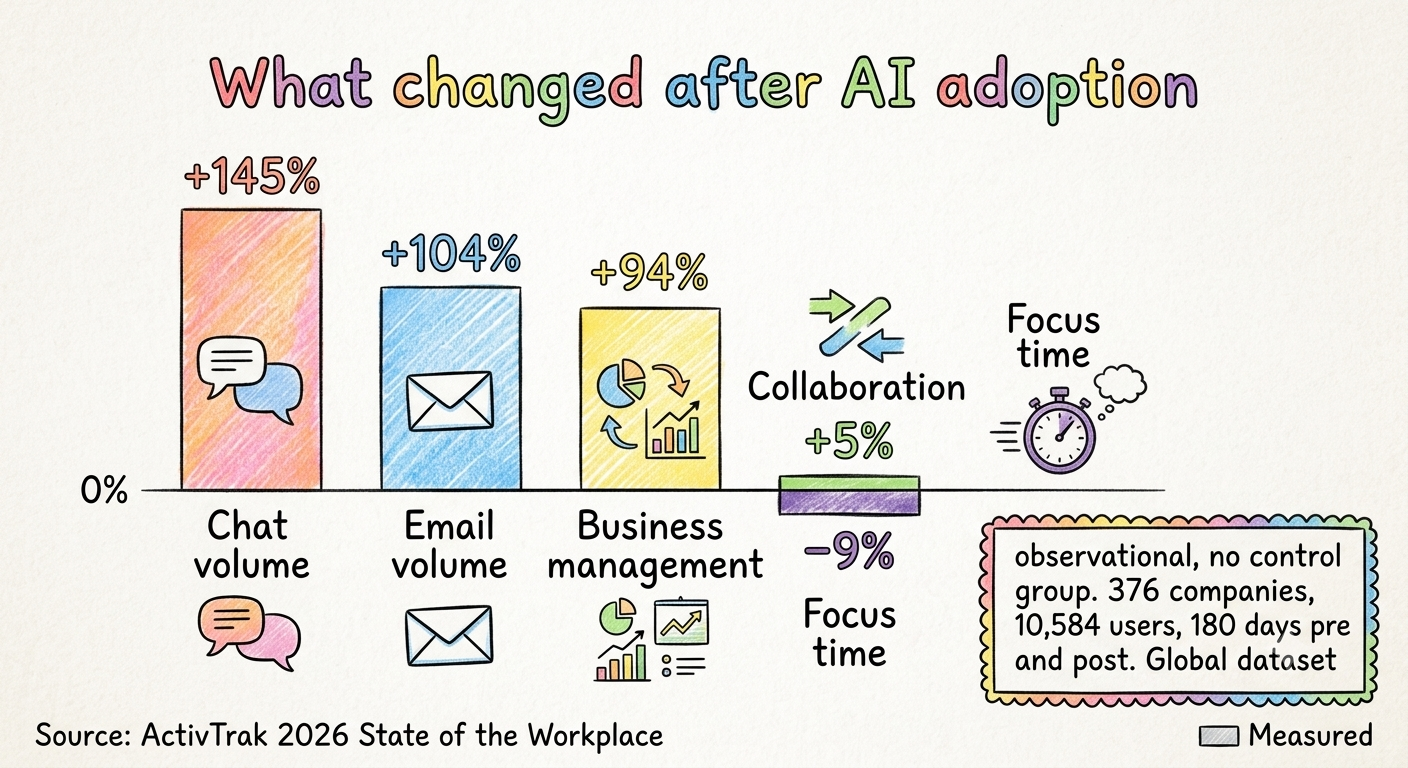
When comparing 180 days before and after AI adoption across 376 companies and 10,584 users, email volume rose 104%, chat volume rose 145%, business management activity rose 94% and collaboration rose 5%, while nothing at all decreased - this was the main finding. Over the same window, AI users' focus time fell 9%, where non-users saw roughly no change.
The mechanism is uncomfortable but it isn't complicated. AI made producing communication cheaper, and communication is the raw material of fragmentation. Drafting the email got faster while reading it did not, so more messages go out, more meetings get arranged, more documents circulate, and everybody's stretches of uninterrupted attention get shorter .
At the individual level the gain is real and quite small. AI users log 6 hours 34 minutes of productive time against 6 hours 17 minutes for non-users, and that seventeen-minute gap has held steady across three consecutive quarters, so it is structural and not novelty. Seventeen minutes, set against email volume doubling.
The condition under which AI does work
The same data also points to something more encouraging. AI doesn't become useful simply because employees use it. It becomes useful when it becomes part of how they work.
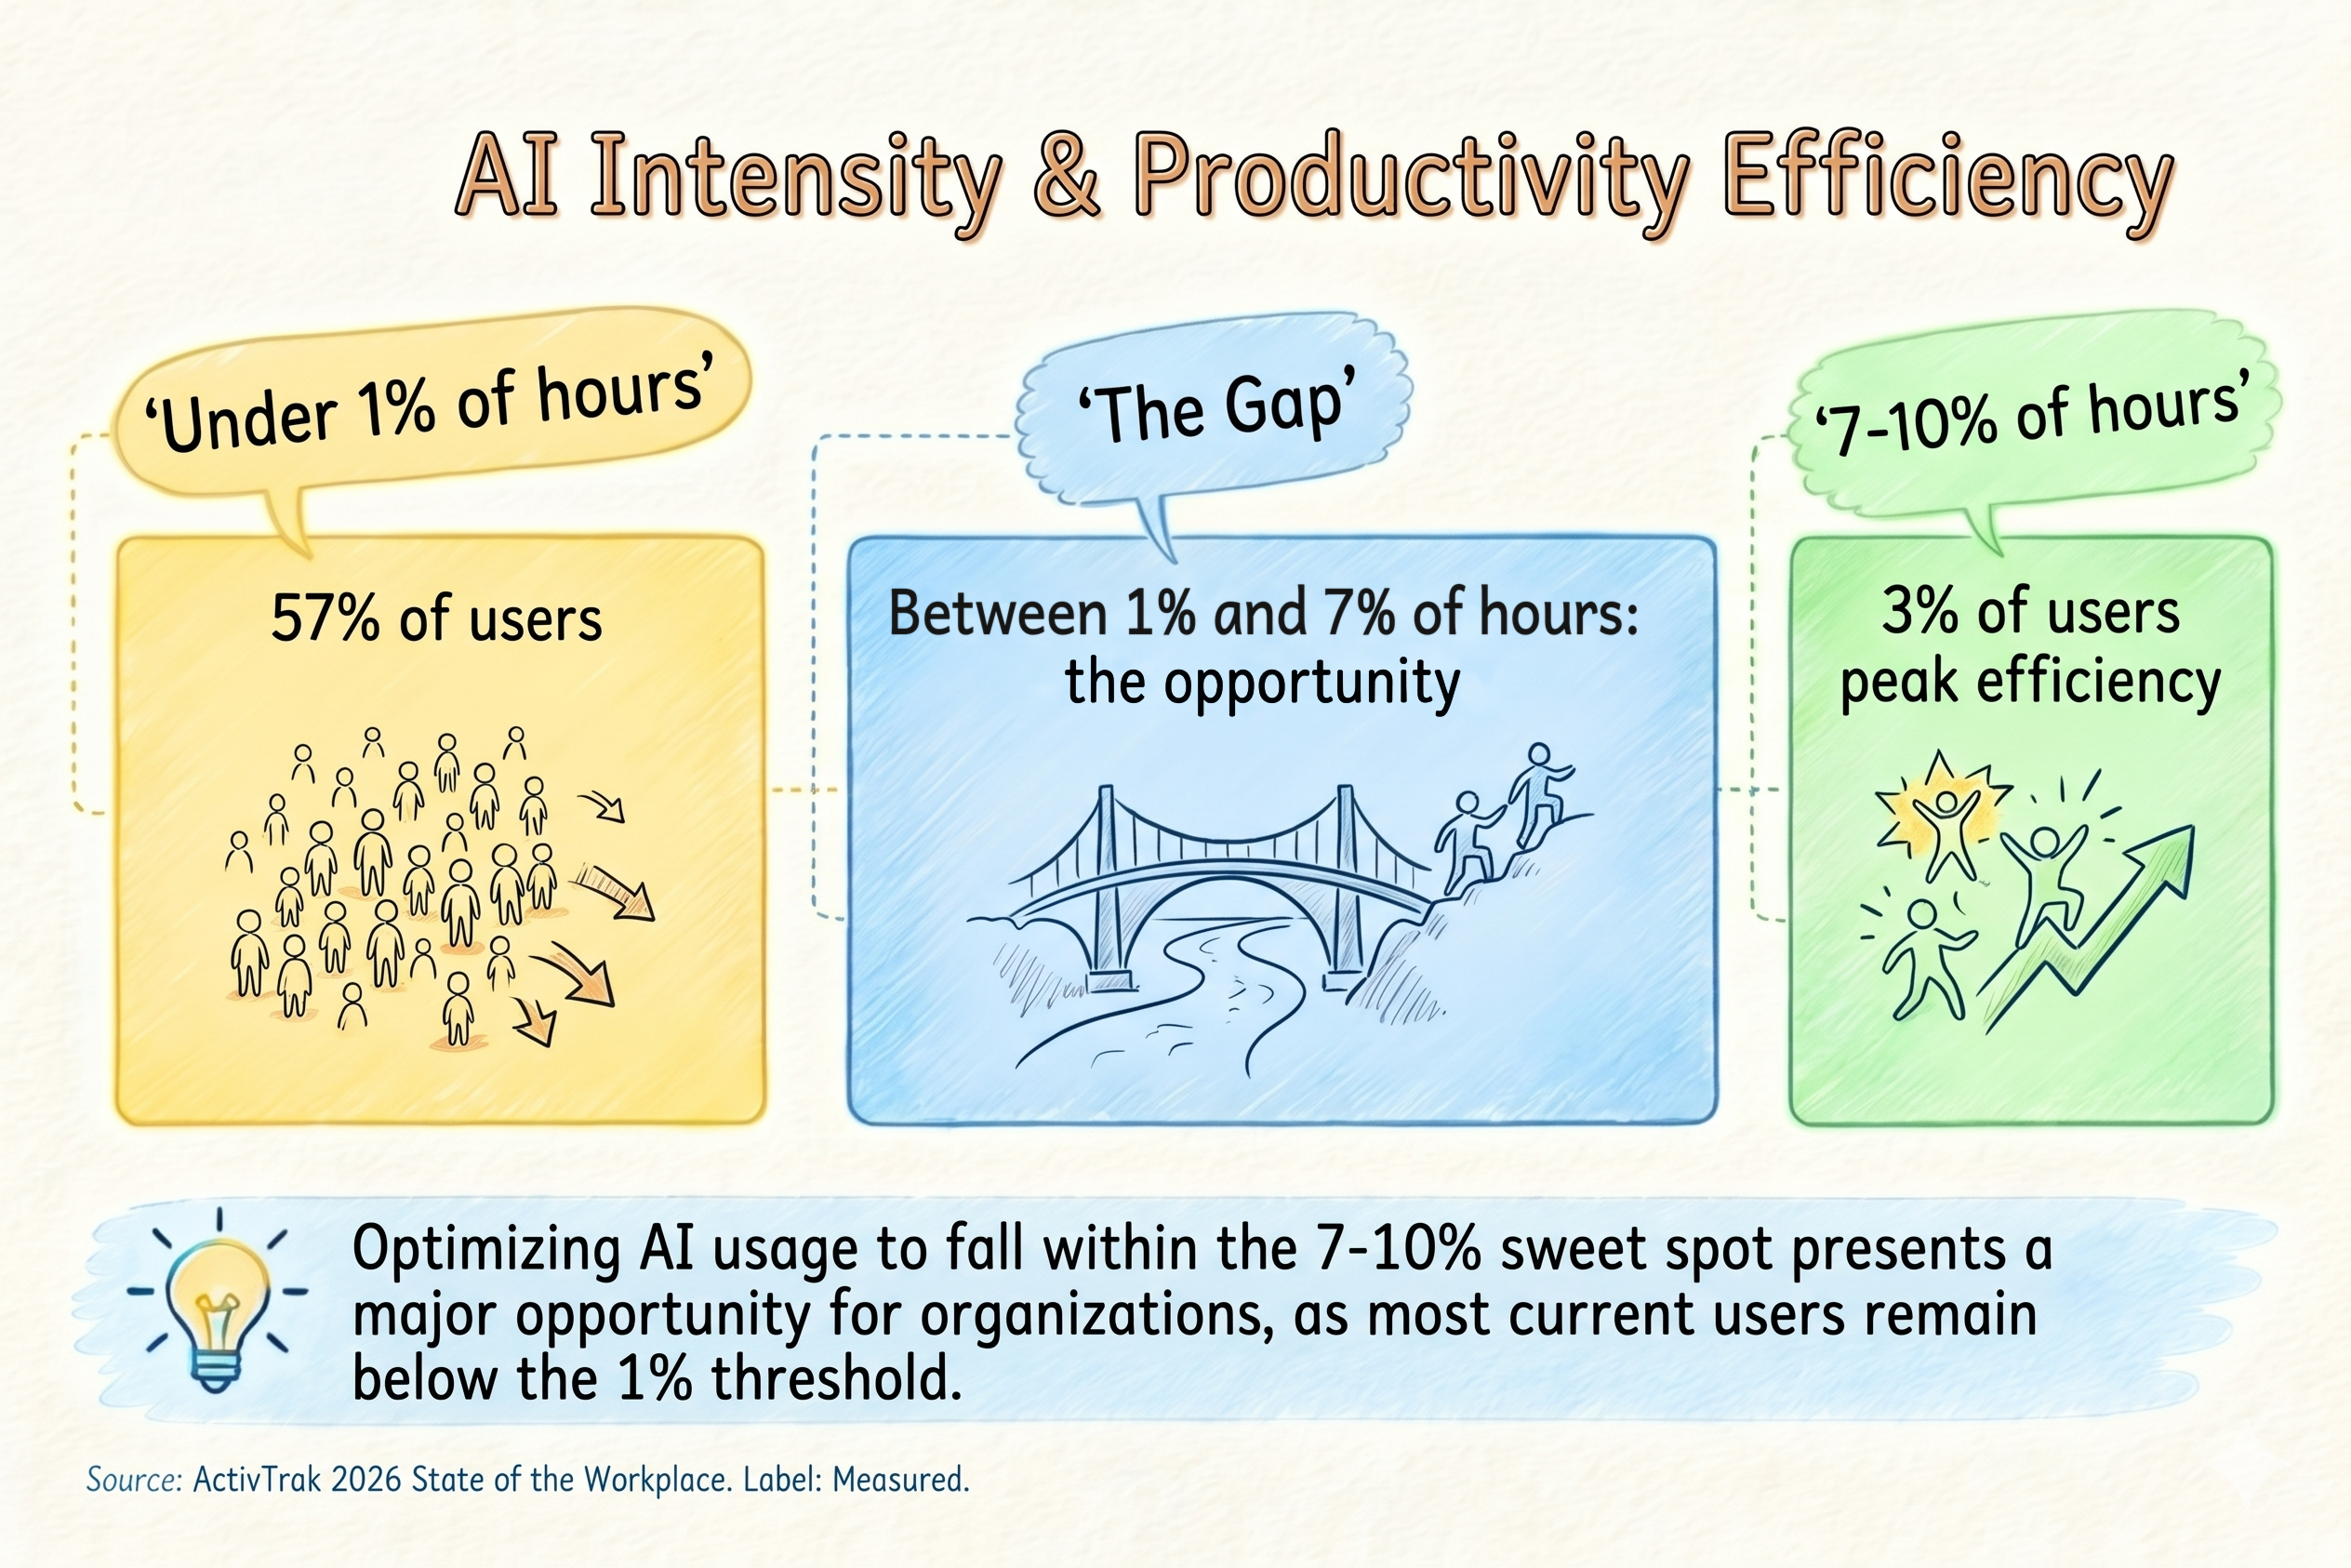
The highest productivity efficiency, around 95%, appears among employees who spend 7-10% of their working hours using AI. Almost nobody has reached that point. Only 3% of users fall into that range today, while 57% still use AI for less than 1% of their working day. In other words, adoption is widespread, but meaningful adoption is still rare.
The same pattern appears when we look at AI maturity. Employees who fully integrate AI into their workflows finish their day in 6 hours and 46 minutes, compared with 7 hours and 5 minutes for those in the intermediate stage. They also maintain healthy utilisation levels that are almost identical to employees who don't rely heavily on AI. Interestingly, the intermediate group records the strongest utilisation balance of any stage, at 75%, which suggests that organisations benefit most when AI complements work instead of replacing it.
The distinction matters because it changes the conclusion. AI doesn't automatically create a workday that is fragmented. What actually splits work is incomplete adoption of AI. Today, 84% of employees remain in the earliest stages of AI maturity, where AI is treated as another application rather than a redesigned way of working. The organisations reporting the strongest productivity gains didn't simply hand out AI licences. They rebuilt workflows around them.
Two more facts complete the entire picture. Half of organisations do not measure AI's impact at all, and only 26% of employees say their leadership is aligned on AI strategy while 65% fear their organisation is falling behind.
All of this is observational with no control group, so it establishes association and not causation. The direction has held across three quarters and two independent datasets, which is worth something without being proof of anything.
Chapter 8: How does employee productivity differ by industry?
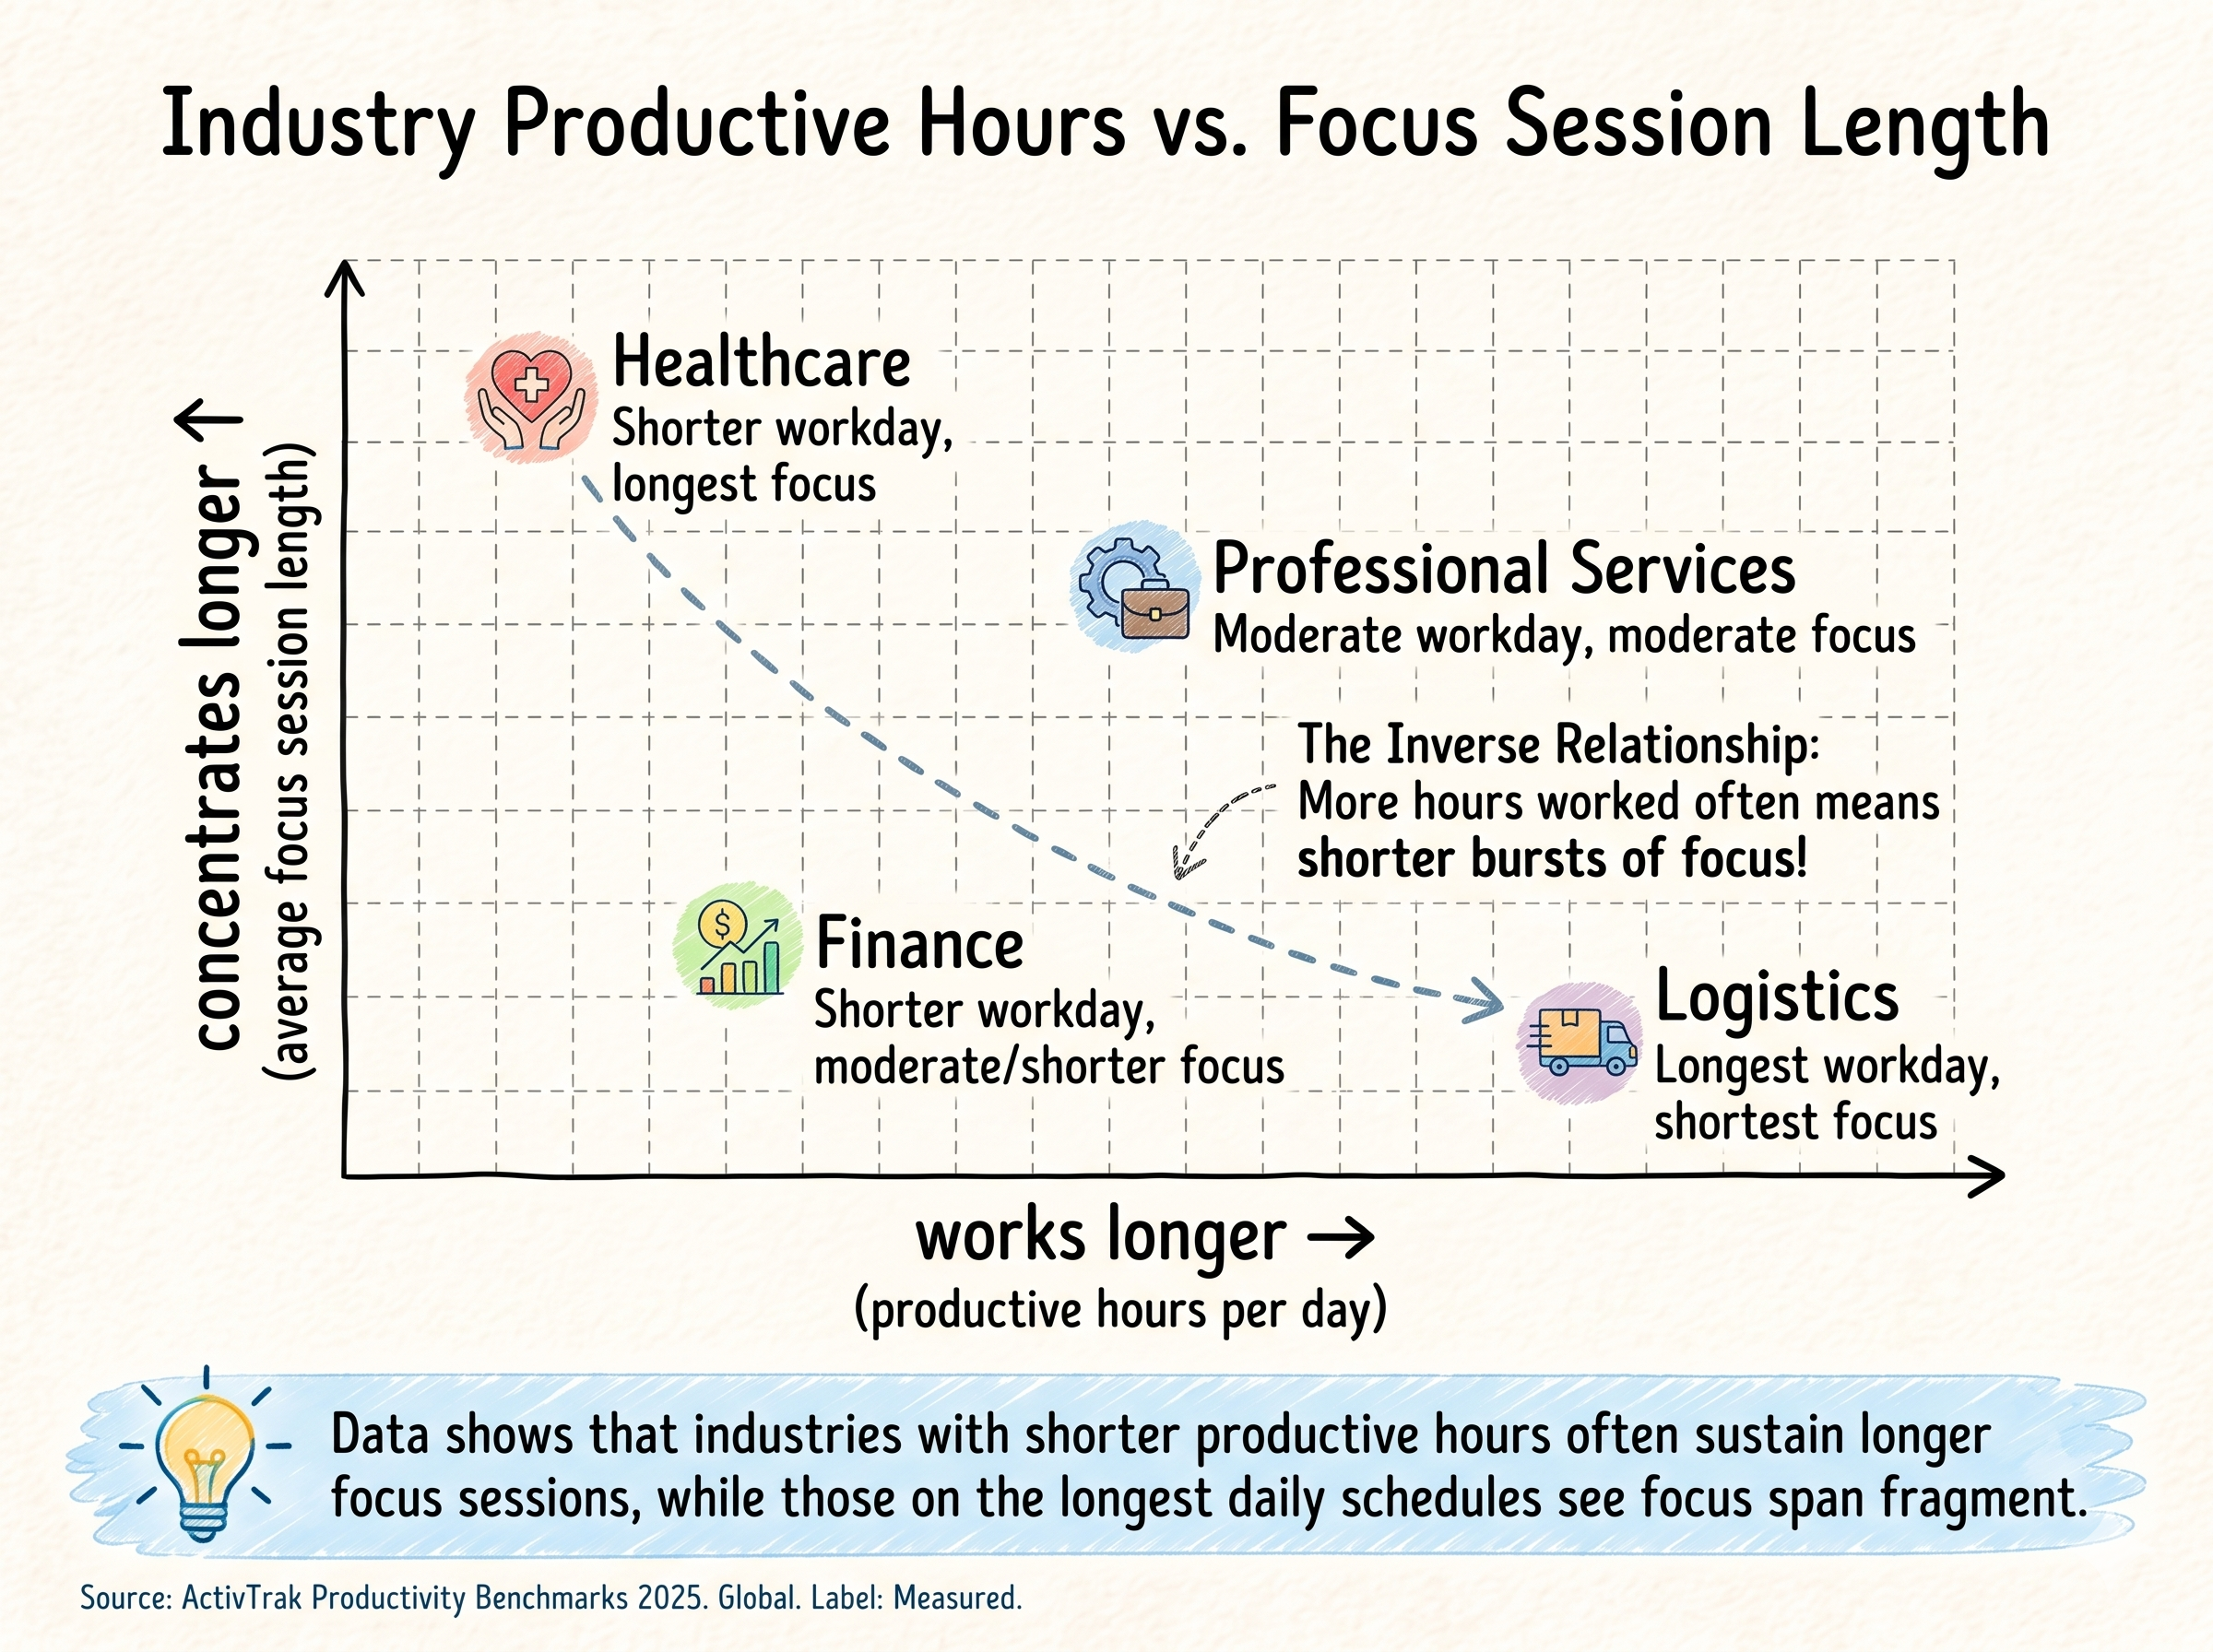
Logistics logs the longest productive day at 7 hours 3 minutes and the shortest focus sessions at 10 minutes 42 seconds. (Source: ActivTrak, Productivity Benchmarks 2025 — global telemetry, no India-specific cut.)
What data available about this is global, drawn from workforce-analytics across 774 companies and 218,900 employees between January 2022 and December 2024, and it is useful for comparing sectors against each other without being an Indian baseline. The pattern across industries is informative even where the levels do not transfer.
| Industry | Productive time | Workday span | Focus time | Avg focus session | AI users | Healthy utilisation |
|---|
| Logistics | 7h 03m | 9h 10m | — | 10m 42s | 72% | 72% |
| Insurance | 6h 35m | — | 4h 37m | — | 51% | 75% |
| Financial services | 6h 32m | 9h 07m | 4h 01m | — | 62% | 74% |
| Healthcare | 6h 26m | — | 4h 47m | 17m 48s | 44% | 69% |
| Cross-industry average (derived) | ≈6h 17m | — | ≈4h 11m | ≈13m 48s | — | — |
The clearest comparison is between logistics and healthcare.
On paper, logistics looks like the harder-working industry. Employees average 7 hours 3 minutes of productive time each day, the highest in the dataset. But that productivity is spread across multiple focus sessions lasting just 10 minutes 42 seconds, the shortest of any sector we analysed.
Healthcare tells a different story. Employees spend slightly less time in productive work overall, yet they record the longest uninterrupted focus sessions at 17 minutes 48 seconds and the highest total focus time.
That contrast isn’t easy to ignore. Simply working longer doesn't appear to produce better conditions for sustained work. Logistics also records the highest burnout risk (15%) and the highest overutilisation (20%), suggesting that extending productive hours without protecting focus may come at a cost.
One note on the figures in this comparison: the cross-industry averages shown in the table are our own calculations based on published datasets rather than values reported directly by the original sources. We also excluded professional services because the only relevant source was available as a scanned document, making the underlying data impossible to extract reliably.
The Indian segment that matters most
Global capability centres (GCCs) are the most relevant segment for Indian knowledge work, and here at least some India-specific data does exist.
India hosts 2,117 GCCs across 3,728 units, employing 2.36 million people and generating $98.4 billion in revenue as of March 2026, with the centre count having grown about 32% since 2021. More than 1,200 of them now hold AI or machine learning capability, employing over 250,000 AI professionals, which comes to roughly 28% of the global GCC AI talent pool.
Two findings there are quite directly revealing about fragmentation. Individual focus work accounts for 47% of employee time in these centres, which caps how much fragmentation the model can absorb before output starts to suffer, and 79% report fewer than one in ten leadership roles based in India, so decisions sit in another timezone and overlap becomes a structural requirement instead of a choice.
Attrition has improved, from 13% in 2023 to 9% in 2025, and 95% of these centres run hybrid which makes a case for the same.
Chapter 9: Can employers legally monitor employee productivity in India?
Yes, but the DPDP Act 2023 requires a defined purpose, and broad indiscriminate surveillance may fail the test.
Nearly every behavioural figure in this report came out of monitoring software, and that deserves examining properly, particularly because our legal position has virtually shifted while we were writing.
India's Digital Personal Data Protection Act received assent in August 2023, and its implementing Rules were notified in November 2025 with an eighteen-month phased compliance window, where penalties reach ₹250 crore. Employee data falls within scope. The Act does treat employment as a legitimate use that dispenses with the consent requirement, permitting processing for purposes of employment or to protect the employer from loss or liability, including prevention of espionage and protection of confidential information.
The employment exemption under the DPDP Act is real, but it is also narrower than many assume. It removes the need for employee consent in certain employment-related situations. It does not remove the rest of the Act's obligations.
Employers still need a clear and legitimate purpose for collecting personal data. They should only collect the data they actually need, protect it appropriately, avoid retaining it longer than necessary, and remain accountable for how it is processed. In other words, the exemption allows monitoring without consent, not monitoring without limits.
Workplace monitoring in India is also shaped by the Information Technology Act, 2000, the 2011 Sensitive Personal Data Rules, and the constitutional right to privacy established in K.S. Puttaswamy. Taken together, these suggest that monitoring with a legitimate business purpose, such as preventing data breaches or protecting confidential information, is more likely to be defensible than broad, continuous surveillance.
Where the line is ultimately drawn remains uncertain. Indian courts have not yet ruled directly on many common workplace monitoring practices, including continuous location tracking, keystroke tracking (which is not acceptable in many places) or wide-ranging employee surveillance. Until that happens, employers should treat proportionality and purpose as guiding principles rather than assuming every form of monitoring is legally settled.
Separately, our four labour codes came into force in November 2025, consolidating twenty-nine central statutes. The occupational safety code sets a maximum of eight hours a day and six days a week, with overtime at twice the wage rate and subject to worker consent. The enacted text carries no numeric weekly cap, since that and the daily spread-over are both delegated to government notification, and most state-level rules are still in draft.
Why this changes what to measure
There is another reason to think about this beyond legal compliance.
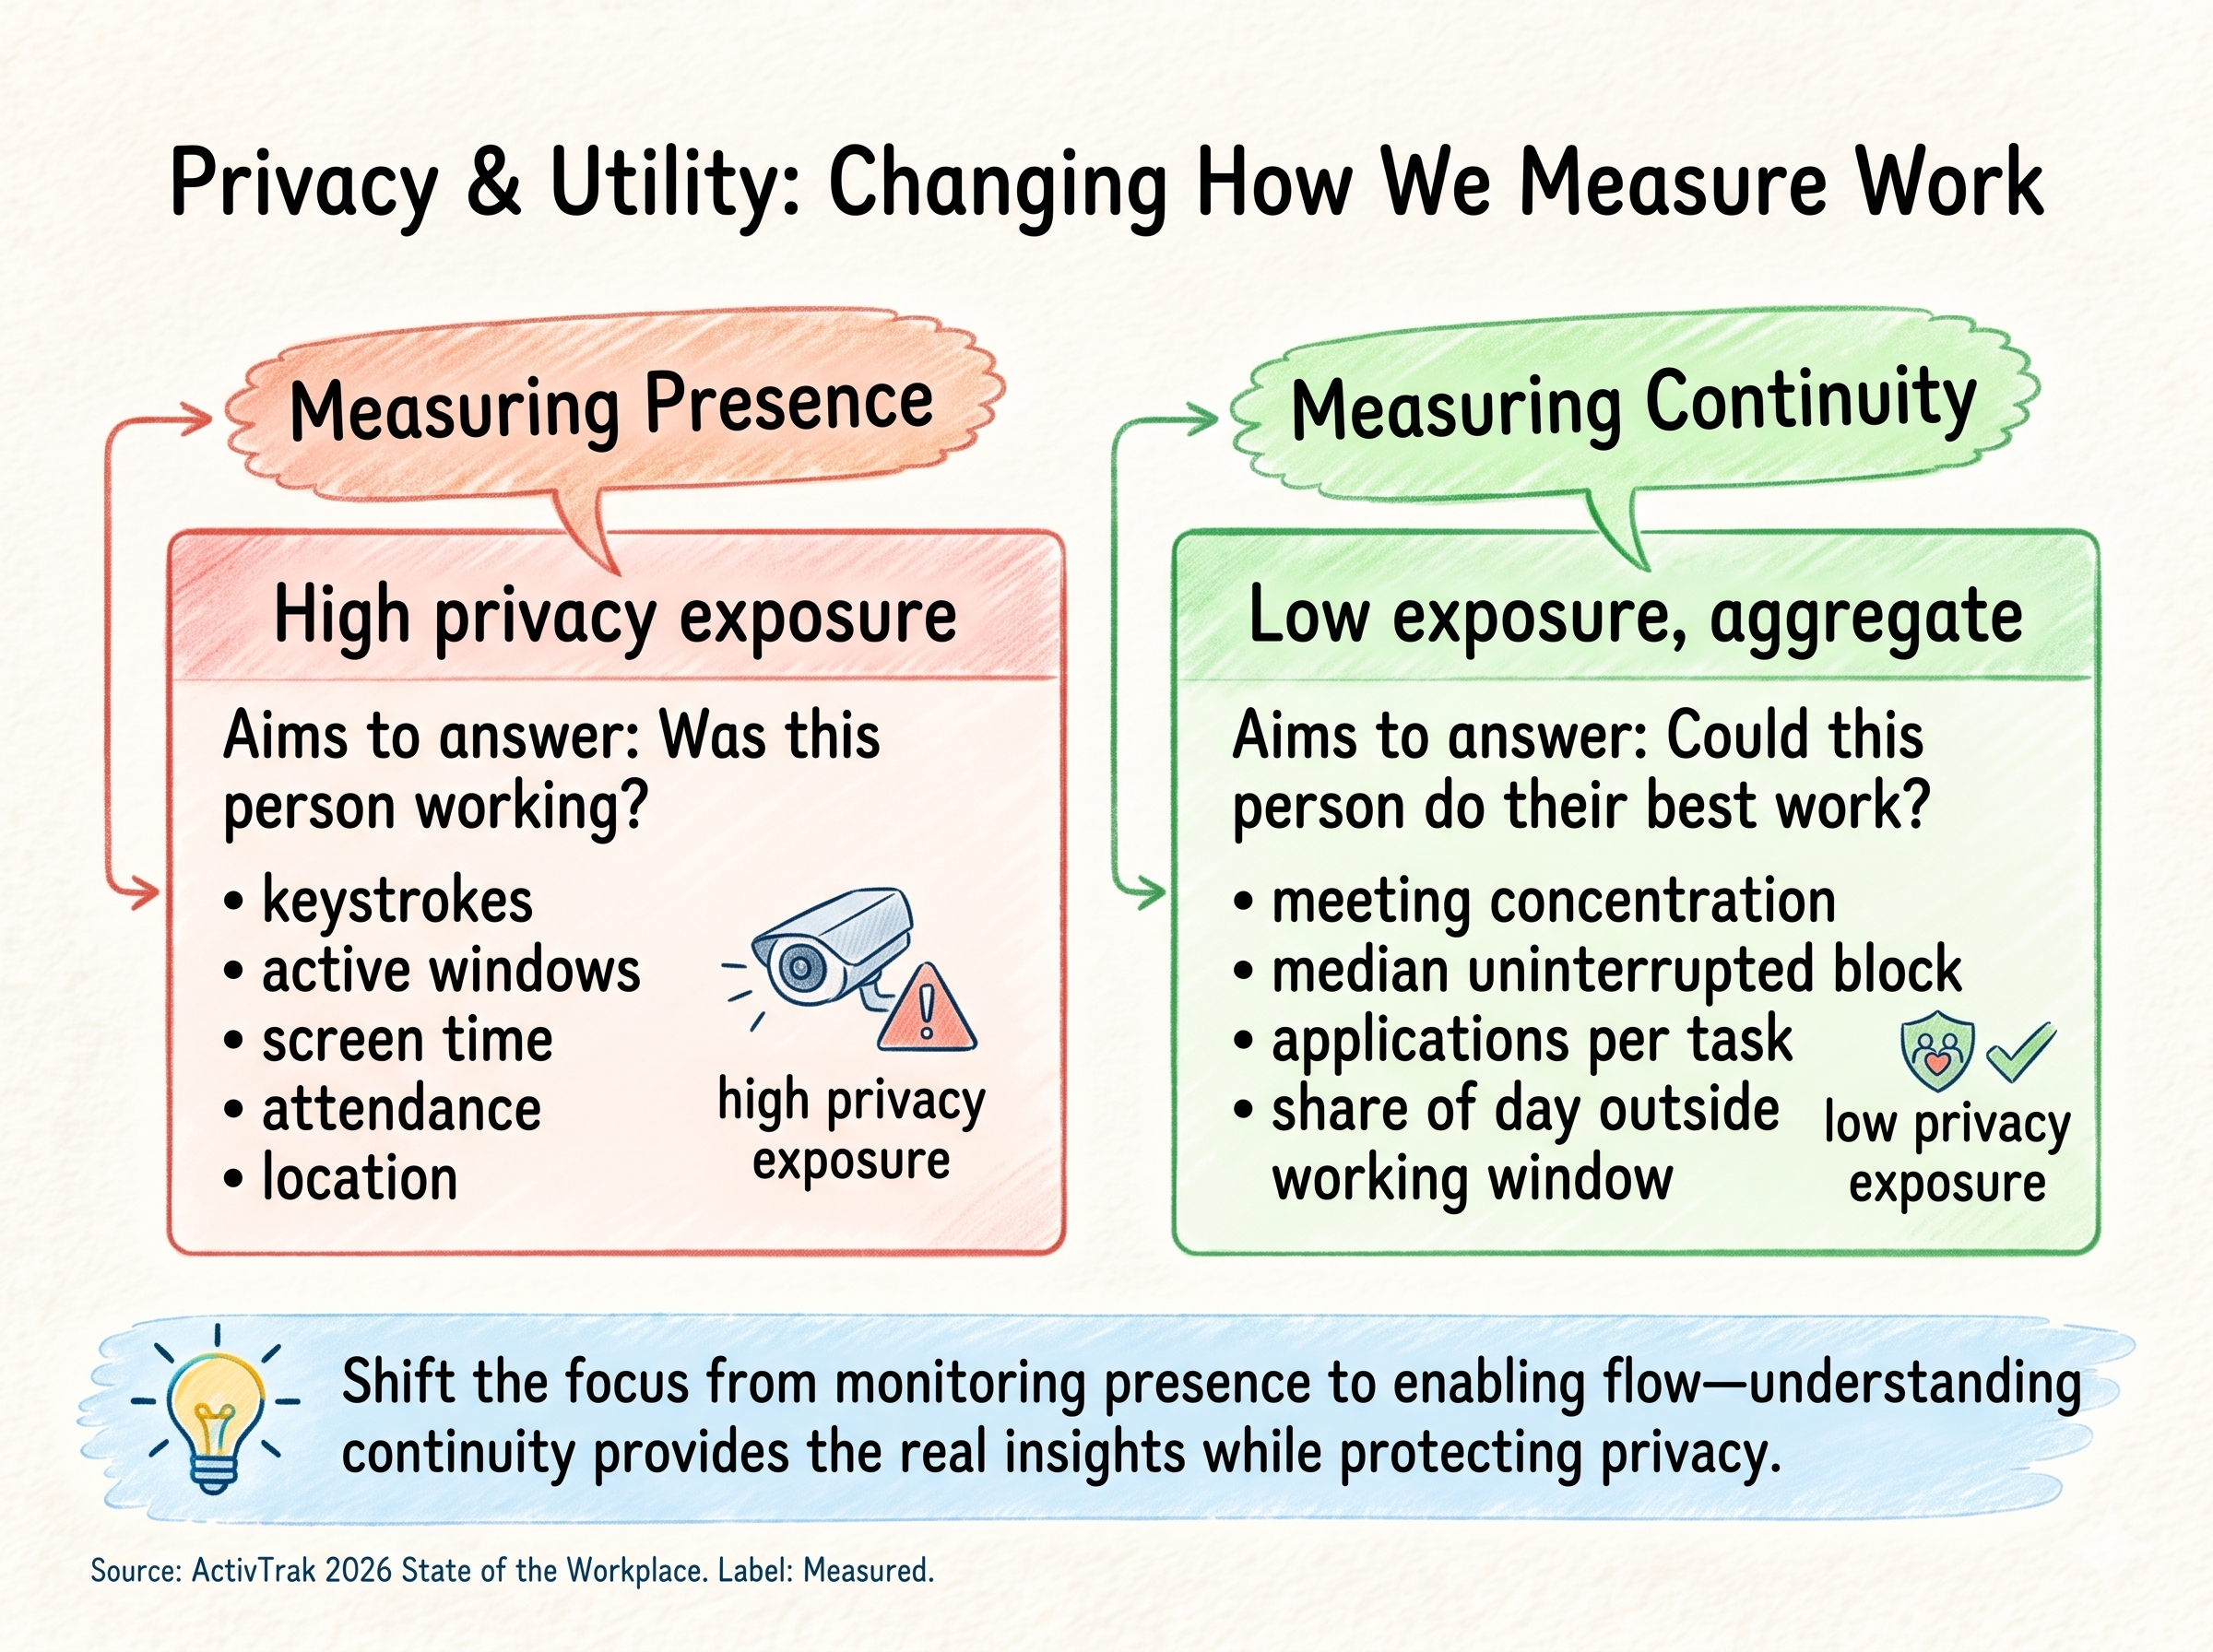
If fragmentation is the real constraint, then many productivity measurement systems are solving the wrong problem. Tracking keystrokes, active windows or screen time may tell you whether someone was at their desk. It tells you very little about whether they had enough uninterrupted time to do meaningful work.
The measures that matter are also far less intrusive. Instead of monitoring individuals, organisations can look at aggregate patterns such as meeting density, the median uninterrupted work block, the number of applications needed to complete a task, or how much work falls outside employees' normal working hours. Most of this information already exists in calendar data, collaboration tools and periodic employee surveys.
Organisations that improve productivity are likely to be the ones that stop treating presence as the goal and start protecting continuity instead. That shift also aligns better with the principles behind the DPDP Act, making it one of the few cases where improving productivity and reducing privacy risk point in the same direction.
Chapter 10: What should Indian employers do about fragmentation in 2026?
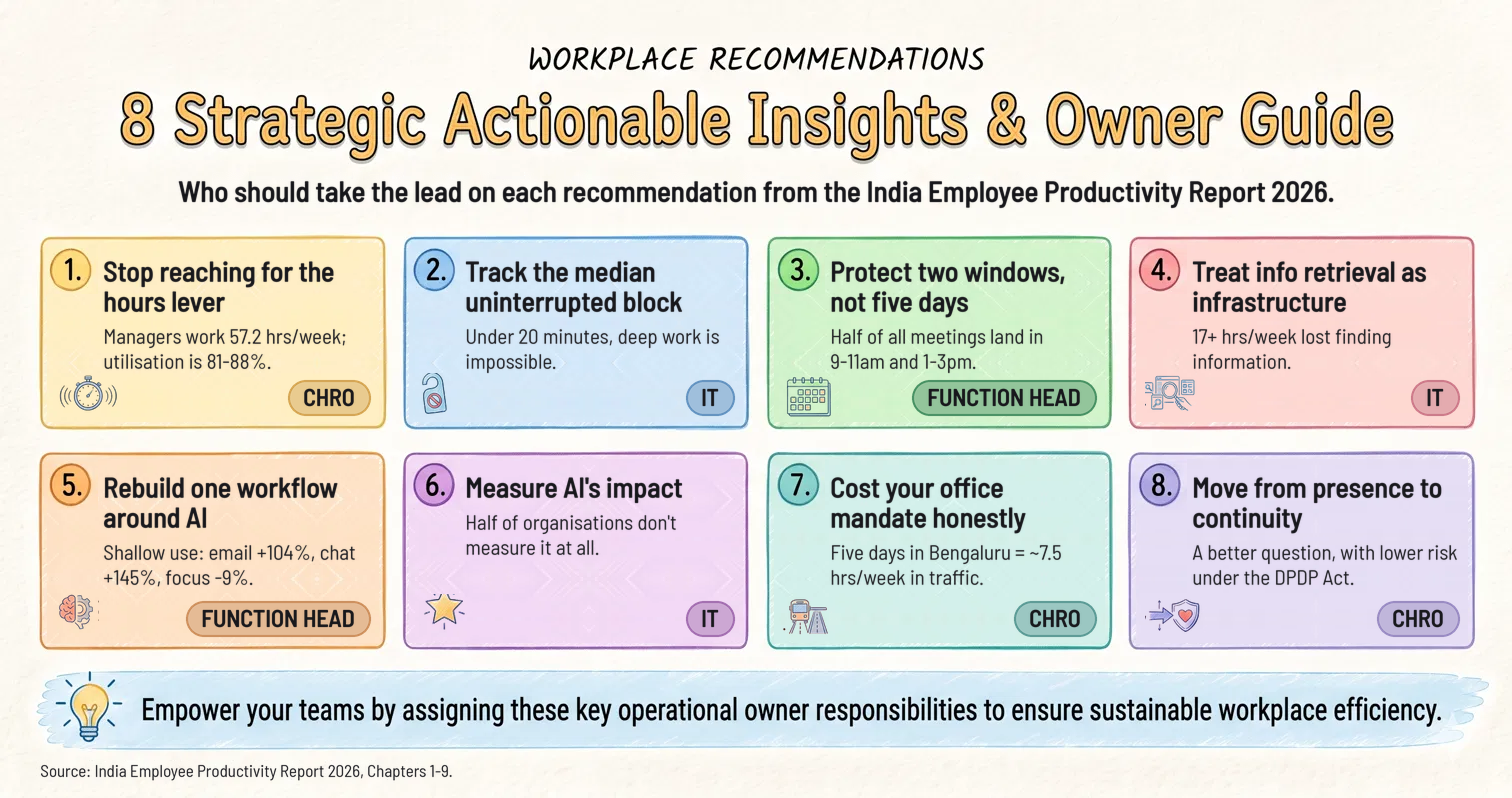
Measure the median uninterrupted work block, protect two windows a day, and rebuild one workflow around AI.
We have made eight recommendations, which are sequenced by impact against the effort taken. All of them are written to be useful to an organisation that needn’t be a Hyring customer, because a playbook that only works if you buy something, in our opinion, is just an advertisement in disguise.
Stop reaching for the hours lever. Indian white-collar hours already rank among the world's highest and utilisation sits near its ceiling, so any plan premised on more hours is planning against the evidence in Chapter 1. Point that ambition at continuity instead.
Track the median uninterrupted block as a core metric. Most organizations already have the calendar and collaboration data to calculate it, and it’s the single most valuable number in this report - yet almost no one tracks it. Simply put, if this number falls under twenty minutes, true deep work is impossible.
Protect two windows, not five work days. Half of all meetings land in two narrow parts of the day, and inverting that by designating periods when meetings aren’t scheduled, costs nothing at all. It does more for output than any attendance policy we have seen.
Treat information retrieval as infrastructure. Seventeen hours a week is the largest single quantified loss in this report, and 72% of Indian respondents interrupt colleagues to find things, which makes it a documentation and search failure wearing the disguise of a collaboration problem. It is also the most tractable target for AI, and 91% of Indian employees already think so.
Rebuild one complete workflow around AI rather than just distributing licenses. Surface-level adoption backfires - it inflates email by 104% and chat by 145%, while dragging focus down by 9%. True integration is what actually shortens workdays. Since 84% of workers remain at shallow maturity, shift your team from merely asking AI questions to handing off whole tasks. Reengineer one core workflow, do it right, and measure the results.
Measure AI's impact. Half of organisations do not, and given near-universal adoption and demonstrably mixed effects, that is a strange thing to leave unmeasured (maybe trust factor is high due to the fact that its proven benefits are delivered reliably to make work easier)
Cost your office mandate honestly. Five days in Bengaluru commits each employee to about seven and a half hours a week in traffic, and the best causal evidence finds no detectable effect of location on performance or promotion alongside a large effect on attrition. Mandates can still be right for specific collaborative work, so argue them on that basis with the commute cost clearly laid out.
Move measurement from presence to continuity. It is a better question and it carries materially less risk under DPDP, and Chapter 9 explains this change in detail already
Frequently asked questions
1. How many hours do Indian employees actually work per week?
Indian managers average 57.2 hours and professionals 51.6, according to ILOSTAT occupation-level data for 2025. The national average across all workers is 45.5 hours on the same source, or 42.2 hours in India's own Periodic Labour Force Survey. National averages come out lower because agricultural and self-employed work pulls them down.
2. Is India's productivity problem caused by employees not working enough?
No, not working enough is not what is causing India’s productivity problem. Close to half of the Indian workforce, 48.8%, already works 49 hours or more weekly, against 11.3% in the United States. Infosys and Wipro have reported utilisation between 81% and 88% for thirteen consecutive quarters. The evidence points to fragmentation of the working day instead of insufficient effort. (Source: ILOSTAT, 2025; Infosys and Wipro quarterly disclosures.)
3. How many productive hours does the average employee get in a day?
Global workplace data covering 1,111 companies puts productive hours for an average employee at 6 hours 36 minutes a day, and no India-specific figure exists. Widely circulated claims of two or three productive hours a day come from monitoring vendors measuring their own self-selected customers, so they should not be treated as national statistics. (Source: ActivTrak, 2026 State of the Workplace.)
4. Do Indians work from home more or less than other countries?
Indians work from home more than most of Asia. Indian employees average 1.6 work-from-home days a week, which is the highest in Asia, level with the United States, and above the 40-country average of 1.2. China records 0.6 days and South Korea 0.5. (Source: Global Survey of Working Arrangements, Wave 4.)
5. Is AI improving productivity for Indian employees?
AI isn’t improving productivity so far, what we see on the evidence available. Eighty per cent of employees use AI but it fills only 0.8% of their working hours, and after adoption email volume rose 104% and chat 145% with no category of work decreasing, while AI users' focus time fell 9%. Only organisations that rebuilt a workflow around the tool show clear gains. (Source: Microsoft, Work Trend Index 2026.)
6. What is the biggest single drain on Indian knowledge worker productivity?
The biggest single drain is actually finding information. Indian respondents to a 12,000-person survey reported losing more than 17 hours a week searching for things they need, with 72% scheduling meetings or interrupting colleagues to locate something. (Source: Atlassian, State of Teams 2025.)
7. Can Indian employers legally track employee productivity?
Yes, within limits. The DPDP Act 2023 treats employment as a legitimate use that removes the consent requirement, but purpose limitation, data minimisation, notice and erasure obligations still apply. Legal commentary suggests targeted monitoring can be justified while broad indiscriminate surveillance may not meet the standard.
8. Which industry has the most fragmented workday?
Logistics, on the available global benchmarks. It records the longest productive day at 7 hours 3 minutes alongside the shortest average focus sessions at 10 minutes 42 seconds, plus the highest burnout risk at 15%. No India-cut industry benchmark exists. (Source: ActivTrak, Productivity Benchmarks 2025.)
Appendix A: Scoring your own organisation
These are the questions we would ask for the four-part diagnostic in Chapter 2, and all four can be answered from data most organisations already hold plus a short survey.
Meeting load. What share of the working day is committed to scheduled meetings, and how is it distributed across the day? What proportion gets convened without advance notice? How many are attended by people with nothing required of them?
Tool switching. How many applications does one representative task cross? How much time goes into locating information instead of acting on it? How often does finding something require interrupting another person?
Interruption rate. What is the median uninterrupted working block? How many messages arrive per working day, and what share lands outside working hours? What response time is expected, formally or otherwise?
Schedule displacement. What share of scheduled time falls outside the employee's local working window? What is the average commute door to door, in minutes? For overlap or shift roles, how many hours a week sit outside a normal circadian window?
Appendix B: Sources
Labour and macroeconomic data International Labour Organization, ILOSTAT. Series HOW_TEMP_SEX_AGE_OCU_NB_A (hours by occupation), HOW_TEMP_SEX_AGE_NB_A (mean weekly hours), EMP_TEMP_SEX_HOW_NB_A (employment by hours band). ilostat.ilo.org/data Ministry of Statistics and Programme Implementation, Periodic Labour Force Survey Annual Report, January-December 2025, Statement 14. Penn World Table 11.0 via Our World in Data: annual working hours per worker, output per hour worked. ourworldindata.org
Corporate disclosures Infosys Limited, quarterly fact sheets, Q1 FY24 to Q1 FY27. Metric: Utilization excluding trainees, Effort & Utilization, Consolidated IT Services. infosys.com/investors Wipro Limited, Analyst Datasheets, Q1 FY24 to Q1 FY27. Metric: Net Utilization excluding Trainees, IT Services excluding BPS. wipro.com/investors
Workplace behaviour and AI ActivTrak, 2026 State of the Workplace: The Rise of Amplified Work. Telemetry, 1,111 companies, 163,638 employees, January 2023 to December 2025. ActivTrak Productivity Lab, enterprise AI adoption analysis. 120,620 users, 1,009 organisations, Q4 2025 to Q2 2026. ActivTrak, Productivity Benchmarks 2025. Telemetry, 774 companies, 218,900 employees, January 2022 to December 2024. Microsoft, Work Trend Index: Breaking down the infinite workday, June 2025. Telemetry to February 2025, excludes EU and education tenants. Survey of 31,000 knowledge workers across 31 markets including India. Microsoft, Work Trend Index 2026. Survey of 20,000 AI users across 10 markets including India, February to April 2026. Atlassian, State of Teams 2025. 12,000 knowledge workers across six markets including India, plus 200 executives. Zylo, 2026 SaaS Management Index. Global. BetterCloud, 2026 State of SaaS. Survey of 525 IT professionals. Global. Capterra India, workplace collaboration survey. 500 India-based remote and hybrid employees, January 2024.
Engagement Gallup, State of the Global Workplace 2026. World Poll, January to December 2025, 263,810 respondents across 140+ countries. Country figures are three-year rolling aggregates. gallup.com/workplace
Work location Global Survey of Working Arrangements, Wave 4, November 2024 to February 2025. India analysis sample 793. Via Stanford Institute for Economic Policy Research. Global Survey of Working Arrangements, Waves 1-2, 2021-22, N=36,078 across 27 countries. Conditional means. Bloom, N. et al. "Hybrid working from home improves retention without damaging performance." Nature, 2024. Randomised controlled trial, n=1,612. TomTom Traffic Index 2025, fifteenth edition, 492 cities. tomtom.com/traffic-index
India sector data Nasscom-Zinnov, India GCC Landscape Report 2026, May 2026. EY, Global Capability Center Pulse Survey, November 2025.
Regulatory Digital Personal Data Protection Act 2023 (Act 22 of 2023), Ministry of Electronics and Information Technology. Digital Personal Data Protection Rules 2025, G.S.R. 846(E), November 2025. Occupational Safety, Health and Working Conditions Code 2020, sections 25 to 28. Press Information Bureau releases on labour codes, November 2025. King Stubb & Kasiva, "Beyond the Screen: employee monitoring and privacy in India," updated May 2026.
Public statements N. R. Narayana Murthy, The Record podcast, 3one4 Capital, 26 October 2023. Quoted via contemporaneous press reporting. S. N. Subrahmanyan, internal employee address, reported 9 January 2025. Quoted via contemporaneous press reporting.
Appendix C: Limitations
- This report contains no primary research, and every figure comes from a published external source.
- No India-cut data exists for application-level usage, interruption telemetry, or the work-model composition of job postings, and each gap is flagged where it falls.
- Workplace behaviour data comes from workforce-analytics vendors whose datasets contain only organisations that installed monitoring software, sample composition is generally undisclosed, and none of it is India-specific.
- "Productive time", "focus time" and "utilisation" are vendor constructs and cannot be compared across similar sources.
- Telemetry and survey findings are labelled separately throughout and never combined.
- India's official and international labour statistics disagree on average weekly hours, so both appear here and neither gets averaged with the other.
- Output-per-hour comparisons are economy-wide averages and are not applied to knowledge workers anywhere in this report.
- Chapter 8 industry benchmarks are global, and the cross-industry averages there are our derivations from published deltas.
- Chapter 7 AI findings are observational, without control groups, so they establish association and not causation.
- Gallup country figures are three-year rolling aggregates and understate single-year movement.
- The "275 interruptions per day" figure quoted widely elsewhere describes the top 20% of users by message volume and not the average worker, and we note it because it is frequently misreported.
- Atlassian India figures were verified through Indian trade press reproducing the publisher's India release and not the report itself, and the India subsample size is not disclosed.
- Return-to-office mandate dates came from the Indian business press where automated retrieval of full articles was blocked, so each needs re-verifying against the original before republication.
India Employee Productivity Report 2026: The Fragmented Workday Hyring · ShootUp Technologies